
Python Pandas 箱线图的实现
更新时间:2019年07月23日 10:36:17 作者:智能先行者
这篇文章主要介绍了Python Pandas 箱线图的实现,文中通过示例代码介绍的非常详细,对大家的学习或者工作具有一定的参考学习价值,需要的朋友们下面随着小编来一起学习学习吧
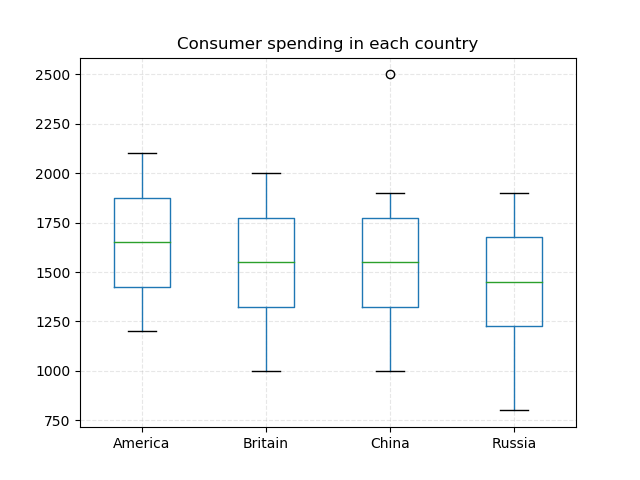
各国家用户消费分布
import numpy as np

import pandas as pd

import matplotlib.pyplot as plt


data = {

  'China': [1000, 1200, 1300, 1400, 1500, 1600, 1700, 1800, 1900, 2500],

  'America': [1200, 1300, 1400, 1500, 1600, 1700, 1800, 1900, 2000, 2100],

  'Britain': [1000, 1200, 1300, 1400, 1500, 1600, 1700, 1800, 1900, 2000],

  "Russia": [800, 1000, 1200, 1300, 1400, 1500, 1600, 1700, 1800, 1900]

}

df = pd.DataFrame(data)


# df.plot.box(title="Consumer spending in each country", vert=False)

df.plot.box(title="Consumer spending in each country")


plt.grid(linestyle="--", alpha=0.3)

plt.show()
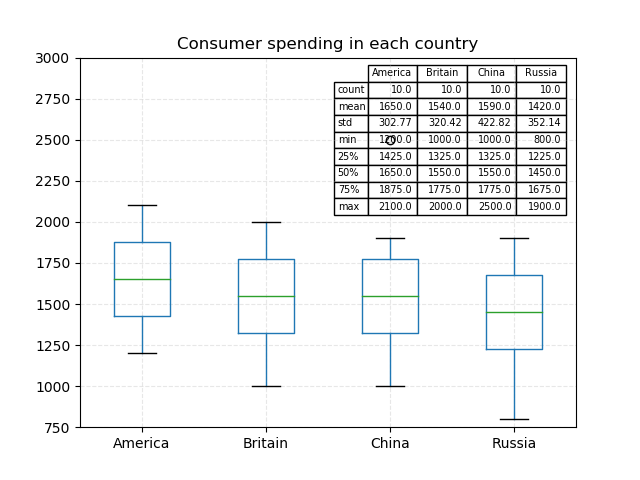
import numpy as np

import pandas as pd

import matplotlib.pyplot as plt


data = {

  'China': [1000, 1200, 1300, 1400, 1500, 1600, 1700, 1800, 1900, 2500],

  'America': [1200, 1300, 1400, 1500, 1600, 1700, 1800, 1900, 2000, 2100],

  'Britain': [1000, 1200, 1300, 1400, 1500, 1600, 1700, 1800, 1900, 2000],

  "Russia": [800, 1000, 1200, 1300, 1400, 1500, 1600, 1700, 1800, 1900]

}

df = pd.DataFrame(data)


from pandas.plotting import table


fig, ax = plt.subplots(1, 1)


table(ax, np.round(df.describe(), 2),

   loc='upper right',

   colWidths=[0.1, 0.1, 0.1, 0.1]

   )


# df.plot.box(title="Consumer spending in each country", vert=False)

df.plot.box(title="Consumer spending in each country",

      ax=ax,

      ylim=(750, 3000))


plt.grid(linestyle="--", alpha=0.3)

plt.show()
import numpy as np

import pandas as pd

import matplotlib.pyplot as plt


data = {"gender": [1, 0, 1, 0, 1, 0, 1, 0, 1, 0],

    'China': [1000, 1200, 1300, 1400, 1500, 1600, 1700, 1800, 1900, 2500],

    'America': [1200, 1300, 1400, 1500, 1600, 1700, 1800, 1900, 2000, 2100]

    }

df = pd.DataFrame(data)


# df.boxplot(column=["China", "America"], by="gender",vert=False)

df.boxplot(column=["China", "America"], by="gender")


plt.grid(linestyle="--", alpha=0.3)

plt.show()

以上就是本文的全部内容,希望对大家的学习有所帮助,也希望大家多多支持脚本之家。
相关文章
 今天小编就为大家分享一篇python 导入数据及作图的实现,具有很好的参考价值,希望对大家有所帮助。一起跟随小编过来看看吧2019-12-12
 有时需求使用JAVA直接调用python脚本,执行一些服务器监控的事情。 本文给出一个java直接调用python脚本的例子2014-02-02
 这篇文章主要介绍了Python 文本滚动播放器的实现代码,本文给大家介绍的非常详细,对大家的学习或工作具有一定的参考借鉴价值,需要的朋友可以参考下2021-04-04
 这篇文章主要介绍了matplotlib grid()设置网格线外观的实现,文中通过示例代码介绍的非常详细,对大家的学习或者工作具有一定的参考学习价值,需要的朋友们下面随着小编来一起学习学习吧2021-02-02
python读取目录下所有的jpg文件,并显示第一张图片的示例
今天小编就为大家分享一篇python读取目录下所有的jpg文件,并显示第一张图片的示例,具有很好的参考价值,希望对大家有所帮助。一起跟随小编过来看看吧2019-06-06 在本篇文章里小编给大家整理的是关于python常用数据重复项处理方法,需要的朋友们参考下。2019-11-11
 本文主要介绍了PyQt转换路径中的斜杠(斜杠(/)与反斜杠(\)转换),文中通过示例代码介绍的非常详细,对大家的学习或者工作具有一定的参考学习价值,需要的朋友们下面随着小编来一起学习学习吧2022-07-07
 今天小编就为大家分享一篇Django项目中包含多个应用时对url的配置方法,具有很好的参考价值,希望对大家有所帮助。一起跟随小编过来看看吧2018-05-05
 这篇文章主要介绍了详解Django框架中用户的登录和退出的实现,Django是重多Python人气框架中最为知名的一个,需要的朋友可以参考下2015-07-07
Python.append()与Python.expand()用法详解
今天小编就为大家分享一篇Python.append()与Python.expand()用法详解,具有很好的参考价值,希望对大家有所帮助。一起跟随小编过来看看吧2019-12-12


最新评论