
Matplotlib animation模块实现动态图
更新时间:2021年02月25日 08:39:45 作者:门下平章
这篇文章主要介绍了Matplotlib animation模块实现动态图,文中通过示例代码介绍的非常详细,对大家的学习或者工作具有一定的参考学习价值,需要的朋友们下面随着小编来一起学习学习吧
matplotlib 画图功能非常强大,目前也只能根据官网 提供的例子简单地画几张图。最近学习了能画动态图的animation模块,作个简单地记录。
在matplotlib作图中,比较常用的是matplotlib.pyplot模块,这个模块有非常多的属性和方法,简要列举下这次用到的方法:
matplotlib.pyplot.subplots(nrows=1, ncols=1, sharex=False, sharey=False, squeeze=True, subplot_kw=None, gridspec_kw=None, **fig_kw)
返回fig和ax对象!
例子1. 动态画出sin函数曲线
import numpy as np
import matplotlib.pyplot as plt
from matplotlib.animation import FuncAnimation

fig, ax = plt.subplots()
xdata, ydata = [], []
ln, = ax.plot([], [], 'r-', animated=False)

def init():
  ax.set_xlim(0, 2*np.pi)
  ax.set_ylim(-1, 1)
  return ln,

def update(frame):
  xdata.append(frame)
  ydata.append(np.sin(frame))
  ln.set_data(xdata, ydata)
  return ln,

ani = FuncAnimation(fig, update, frames=np.linspace(0, 2*np.pi, 128),
          init_func=init, blit=True)
plt.show()
画这类图的关键是要给出不断更新的函数,这里就是update 函数了。注意, line, = ax.plot([], [], 'r-', animated=False) 中的, 表示创建tuple类型。迭代更新的数据frame 取值从frames 取得。
例子2. 动态显示一个动点,它的轨迹是sin函数。
import numpy as np
import matplotlib.pyplot as plt
from matplotlib import animation

"""
animation example 2
author: Kiterun
"""

fig, ax = plt.subplots()
x = np.linspace(0, 2*np.pi, 200)
y = np.sin(x)
l = ax.plot(x, y)
dot, = ax.plot([], [], 'ro')

def init():
  ax.set_xlim(0, 2*np.pi)
  ax.set_ylim(-1, 1)
  return l

def gen_dot():
  for i in np.linspace(0, 2*np.pi, 200):
    newdot = [i, np.sin(i)]
    yield newdot

def update_dot(newd):
  dot.set_data(newd[0], newd[1])
  return dot,

ani = animation.FuncAnimation(fig, update_dot, frames = gen_dot, interval = 100, init_func=init)
ani.save('sin_dot.gif', writer='imagemagick', fps=30)

plt.show()
这里我们把生成的动态图保存为gif图片,前提要预先安装imagemagic。
例子3. 单摆(没阻尼&有阻尼)
无阻尼的单摆力学公式:
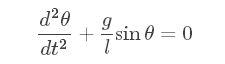
附加阻尼项:

这里需要用到scipy.integrate的odeint模块,具体用法找时间再专门写一篇blog吧,动态图代码如下:
# -*- coding: utf-8 -*-

from math import sin, cos
import numpy as np
from scipy.integrate import odeint
import matplotlib.pyplot as plt
import matplotlib.animation as animation

g = 9.8
leng = 1.0
b_const = 0.2

# no decay case:
def pendulum_equations1(w, t, l):
  th, v = w
  dth = v
  dv = - g/l * sin(th)
  return dth, dv

# the decay exist case:
def pendulum_equations2(w, t, l, b):
  th, v = w
  dth = v
  dv = -b/l * v - g/l * sin(th)
  return dth, dv

t = np.arange(0, 20, 0.1)
track = odeint(pendulum_equations1, (1.0, 0), t, args=(leng,))
#track = odeint(pendulum_equations2, (1.0, 0), t, args=(leng, b_const))
xdata = [leng*sin(track[i, 0]) for i in range(len(track))]
ydata = [-leng*cos(track[i, 0]) for i in range(len(track))]

fig, ax = plt.subplots()
ax.grid()
line, = ax.plot([], [], 'o-', lw=2)
time_template = 'time = %.1fs'
time_text = ax.text(0.05, 0.9, '', transform=ax.transAxes)

def init():
  ax.set_xlim(-2, 2)
  ax.set_ylim(-2, 2)
  time_text.set_text('')
  return line, time_text

def update(i):
  newx = [0, xdata[i]]
  newy = [0, ydata[i]]
  line.set_data(newx, newy)
  time_text.set_text(time_template %(0.1*i))
  return line, time_text

ani = animation.FuncAnimation(fig, update, range(1, len(xdata)), init_func=init, interval=50)
#ani.save('single_pendulum_decay.gif', writer='imagemagick', fps=100)
ani.save('single_pendulum_nodecay.gif', writer='imagemagick', fps=100)
plt.show()

例子4. 滚动的球
import numpy as np
import matplotlib.pyplot as plt
import matplotlib.animation as animation

fig = plt.figure(figsize=(6, 6))
ax = plt.gca()
ax.grid()
ln1, = ax.plot([], [], '-', lw=2)
ln2, = ax.plot([], [], '-', color='r', lw=2)
theta = np.linspace(0, 2*np.pi, 100)
r_out = 1
r_in = 0.5

def init():
  ax.set_xlim(-2, 2)
  ax.set_ylim(-2, 2)
  x_out = [r_out*np.cos(theta[i]) for i in range(len(theta))]
  y_out = [r_out*np.sin(theta[i]) for i in range(len(theta))]
  ln1.set_data(x_out, y_out)
  return ln1,

def update(i):
  x_in = [(r_out-r_in)*np.cos(theta[i])+r_in*np.cos(theta[j]) for j in range(len(theta))]
  y_in = [(r_out-r_in)*np.sin(theta[i])+r_in*np.sin(theta[j]) for j in range(len(theta))]
  ln2.set_data(x_in, y_in)
  return ln2,

ani = animation.FuncAnimation(fig, update, range(len(theta)), init_func=init, interval=30)
ani.save('roll.gif', writer='imagemagick', fps=100)

plt.show()
到此这篇关于Matplotlib animation模块实现动态图 的文章就介绍到这了,更多相关Matplotlib 动态图 内容请搜索脚本之家以前的文章或继续浏览下面的相关文章希望大家以后多多支持脚本之家!
相关文章
 贪吃蛇是款经典游戏,本文将带你一步步用python语言实现一个贪吃蛇小游戏,具有一定的参考价值,感兴趣的小伙伴们可以参考一下2018-11-11
Python两个内置函数 locals 和globals(学习笔记)
这篇文章主要介绍了Python两个内置函数 locals 和globals(学习笔记),需要的朋友可以参考下2016-08-08 这篇文章主要介绍了python线程类改变类变量的操作代码,本文给大家介绍的非常详细,对大家的学习或工作具有一定的参考借鉴价值,需要的朋友可以参考下2024-01-01
 这篇文章主要介绍了关于Python调用百度语音合成SDK实现文字转音频的方法,AipSpeech是语音合成的Python SDK客户端,为使用语音合成的开发人员提供了一系列的交互方法,需要的朋友可以参考下2023-07-07
用 Python 定义 Schema 并生成 Parquet 文件详情
本文将演示两个例子,一个是没有层级的两个字段,另一个是含于嵌套级别的字段,将要使用到的 Python 模块有 pandas 和 pyarrow,感兴趣是我小伙伴请和小编一起学习下面文章内容吧2021-09-09 最近,在做测试开发平台的时候,需要对测试用例的列表进行后端分页,在实际去写代码和测试的过程中,发现这里面还是有些细节的,故想复盘一下2021-09-09
解决python中遇到字典里key值为None的情况,取不出来的问题
今天小编就为大家分享一篇解决python中遇到字典里key值为None的情况,取不出来的问题,具有很好的参考价值,希望对大家有所帮助。一起跟随小编过来看看吧2018-10-10 包装是指对一个已经存在的对象进行系定义加工,实现授权是包装的一个特性,下面这篇文章主要给大家介绍了关于python包装和授权的相关资料,文中通过实例代码介绍的非常详细,需要的朋友可以参考下2023-06-06
 这篇文章主要介绍了将bag文件批量转成mp4,这篇博客涉及的脚本用来将bag文件批量转化为mp4文件,本文给大家介绍的非常详细,对大家的学习或工作具有一定的参考借鉴价值,需要的朋友可以参考下2022-10-10
 本文主要介绍了Python实现字符串反转的9种方法,文中通过示例代码介绍的非常详细,对大家的学习或者工作具有一定的参考学习价值,需要的朋友们下面随着小编来一起学习学习吧2023-07-07


最新评论