
利用Python制作PPT的完整步骤
更新时间:2021年09月06日 10:40:19 作者:tugouxp
这篇文章主要给大家介绍了关于如何利用Python制作PPT的相关资料,主要利用的是python-pptx库,我们可以通过写脚本,来定时执行更新ppt内容,需要的朋友可以参考下
前言
怎么,你还没学Python吗? 此一时彼以时,什么C,JAVA,现在在求职市场都是渣渣,铺天盖地的Python学习广告,一遍又一遍地提醒着着我,你已经老了:
老板说:你很努力,但我还是想提拔会Python的人。
员工说:自从学了Python,腰不疼了,腿不酸了,颈椎不痛了,连工资都涨了。。。
码农说:我要偷偷学Python,惊呆所有人!
。。。。。。
所以,为了不被时代滚滚洪流淘汰,争取抓上时代前进的末班车,我也要学Python了,从最实用的-文案(吹)PPT(牛逼)做起。
下面开始技术流。
步骤1:
Python存在不同版本之间的兼容性问题,所以有必要说明一下版本,这里我在Ubuntu系统上使用Python3为例,如果你的系统不是Python3.请按照如下步骤修改:
caozilong@caozilong-Vostro-3268:/usr/bin$ sudo rm python
caozilong@caozilong-Vostro-3268:/usr/bin$ sudo ln -s /usr/bin/python3 /usr/bin/python
caozilong@caozilong-Vostro-3268:/usr/bin$
步骤2:安装PIP3
安装PIP3的目的是为了安装 Python PPT插件,作为Python3上的包管理工具,PIP3不可或缺。
caozilong@caozilong-Vostro-3268:~/Workspace/python-ppt$ sudo apt install python3-pip
[sudo] caozilong 的密码:
正在读取软件包列表... 完成
正在分析软件包的依赖关系树
正在读取状态信息... 完成
python3-pip 已经是最新版 (9.0.1-2.3~ubuntu1.18.04.5)。
下列软件包是自动安装的并且现在不需要了:
  libegl1-mesa libfwup1 libllvm9 python-kerberos
使用'sudo apt autoremove'来卸载它(它们)。
升级了 0 个软件包,新安装了 0 个软件包,要卸载 0 个软件包,有 10 个软件包未被升级。
caozilong@caozilong-Vostro-3268:~/Workspace/python-ppt$
步骤3:安装python-pptx
caozilong@caozilong-Vostro-3268:~/Workspace/python-ppt$ sudo pip3 install python-pptx
The directory '/home/caozilong/.cache/pip/http' or its parent directory is not owned by the current user and the cache has been disabled. Please check the permissions and owner of that directory. If executing pip with sudo, you may want sudo's -H flag.
The directory '/home/caozilong/.cache/pip' or its parent directory is not owned by the current user and caching wheels has been disabled. check the permissions and owner of that directory. If executing pip with sudo, you may want sudo's -H flag.
Collecting python-pptx
  Downloading https://files.pythonhosted.org/packages/53/ed/547be9730350509253bc7d76631a8ffcd1a62dda4d7482fb25d369696e37/python-pptx-0.6.19.tar.gz (9.3MB)
    100% |████████████████████████████████| 9.3MB 180kB/s
Requirement already satisfied: Pillow>=3.3.2 in /usr/lib/python3/dist-packages (from python-pptx)
Collecting XlsxWriter>=0.5.7 (from python-pptx)
  Downloading https://files.pythonhosted.org/packages/93/51/11cb4545e95f1a845a6ca5475eb425272dc32c2f0e3592d80e7abd491374/XlsxWriter-1.4.4-py2.py3-none-any.whl (149kB)
    100% |████████████████████████████████| 153kB 5.9MB/s
Collecting lxml>=3.1.0 (from python-pptx)
  Downloading https://files.pythonhosted.org/packages/1f/1d/a4485412268b38043a6c0f873245b5d9315c6615bcf44776759a2605dca5/lxml-4.6.3-cp36-cp36m-manylinux1_x86_64.whl (5.5MB)
    100% |████████████████████████████████| 5.5MB 295kB/s
Installing collected packages: XlsxWriter, lxml, python-pptx
  Running setup.py install for python-pptx ... done
Successfully installed XlsxWriter-1.4.4 lxml-4.6.3 python-pptx-0.6.19
caozilong@caozilong-Vostro-3268:~/Workspace/python-ppt$
4.写代码测试:
#!/usr/bin/env python3
# -*- coding: utf-8 -*-
from pptx import Presentation
prs = Presentation()
title_slide_layout = prs.slide_layouts[0]
slide = prs.slides.add_slide(title_slide_layout)
title = slide.shapes.title
subtitle = slide.placeholders[1]
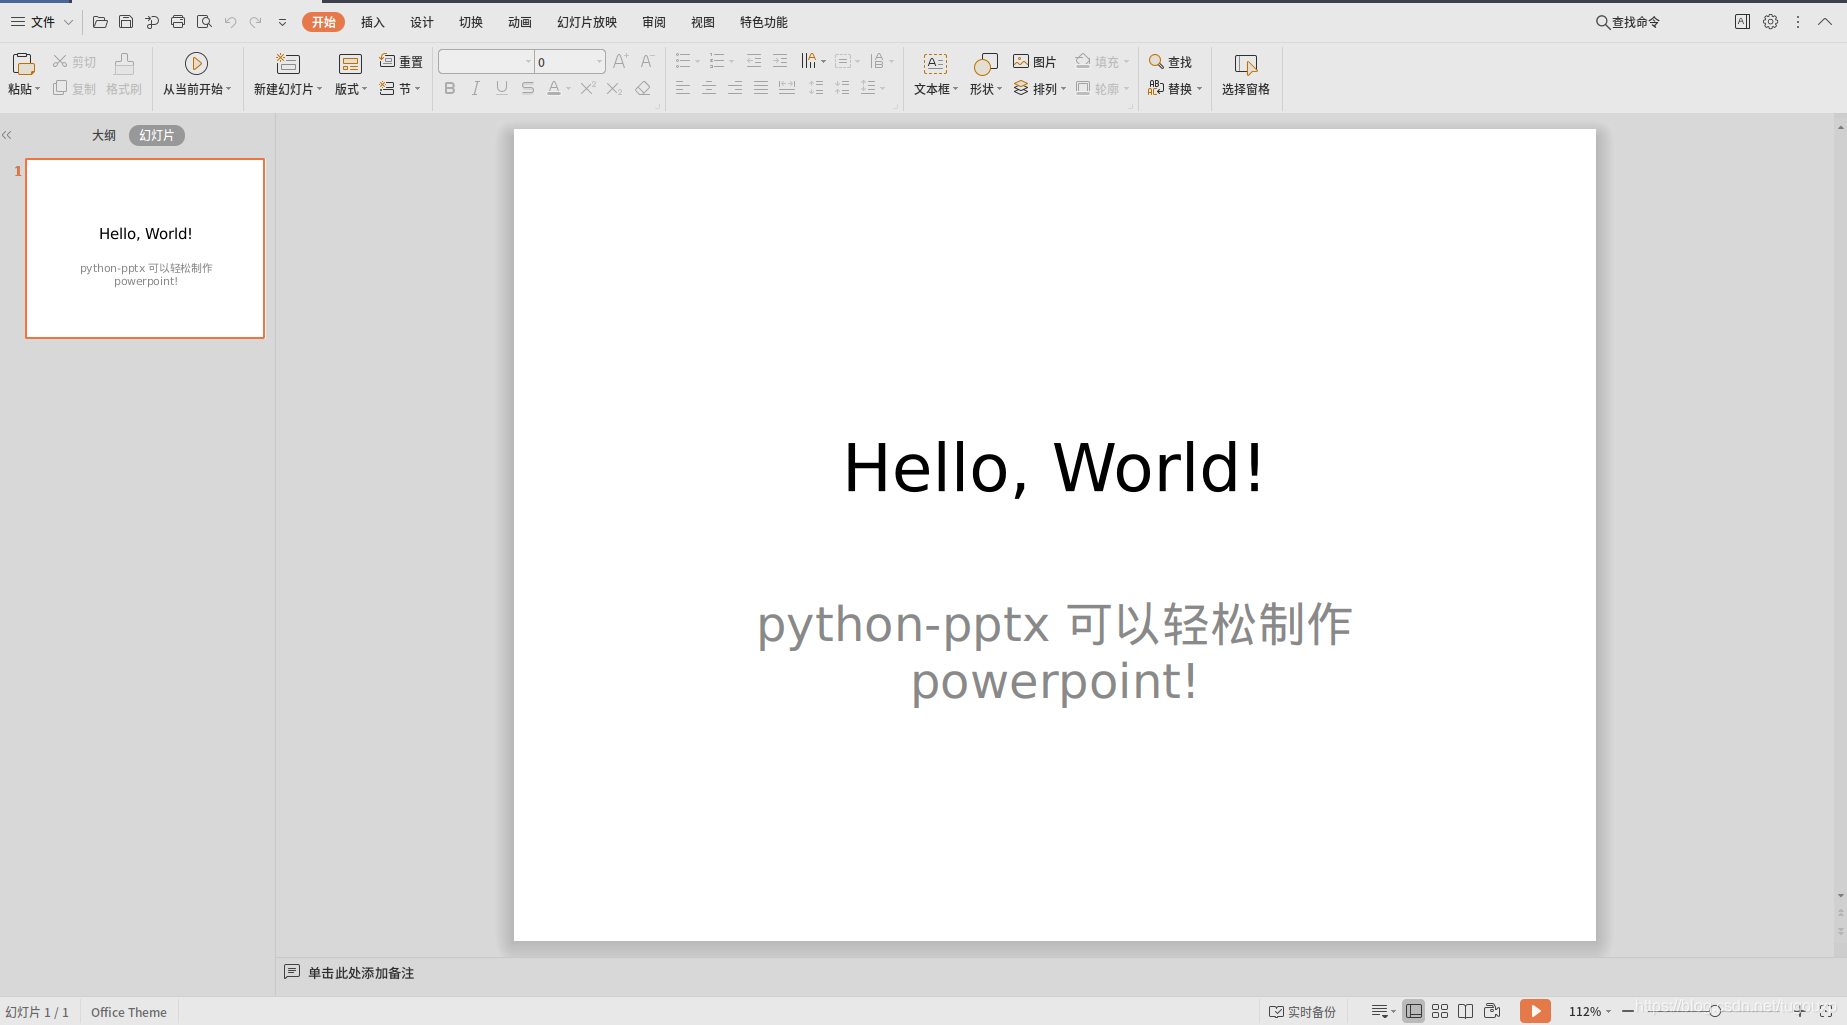
title.text = "Hello, World!"
subtitle.text = "python-pptx 可以轻松制作powerpoint!"
prs.save('czl.pptx')
执行:
caozilong@caozilong-Vostro-3268:~/Workspace/python-ppt$ python py1.py
caozilong@caozilong-Vostro-3268:~/Workspace/python-ppt$ ls -l
总用量 32
-rw-rw-r-- 1 caozilong caozilong 28292 7月  18 15:51 czl.pptx
-rw-rw-r-- 1 caozilong caozilong   362 7月  18 15:51 py1.py
caozilong@caozilong-Vostro-3268:~/Workspace/python-ppt$
用WPS打开czl.pptx.
from pptx import Presentation
prs = Presentation()
bullet_slide_layout = prs.slide_layouts[1]
slide = prs.slides.add_slide(bullet_slide_layout)
shapes = slide.shapes
title_shape = shapes.title
body_shape = shapes.placeholders[1]
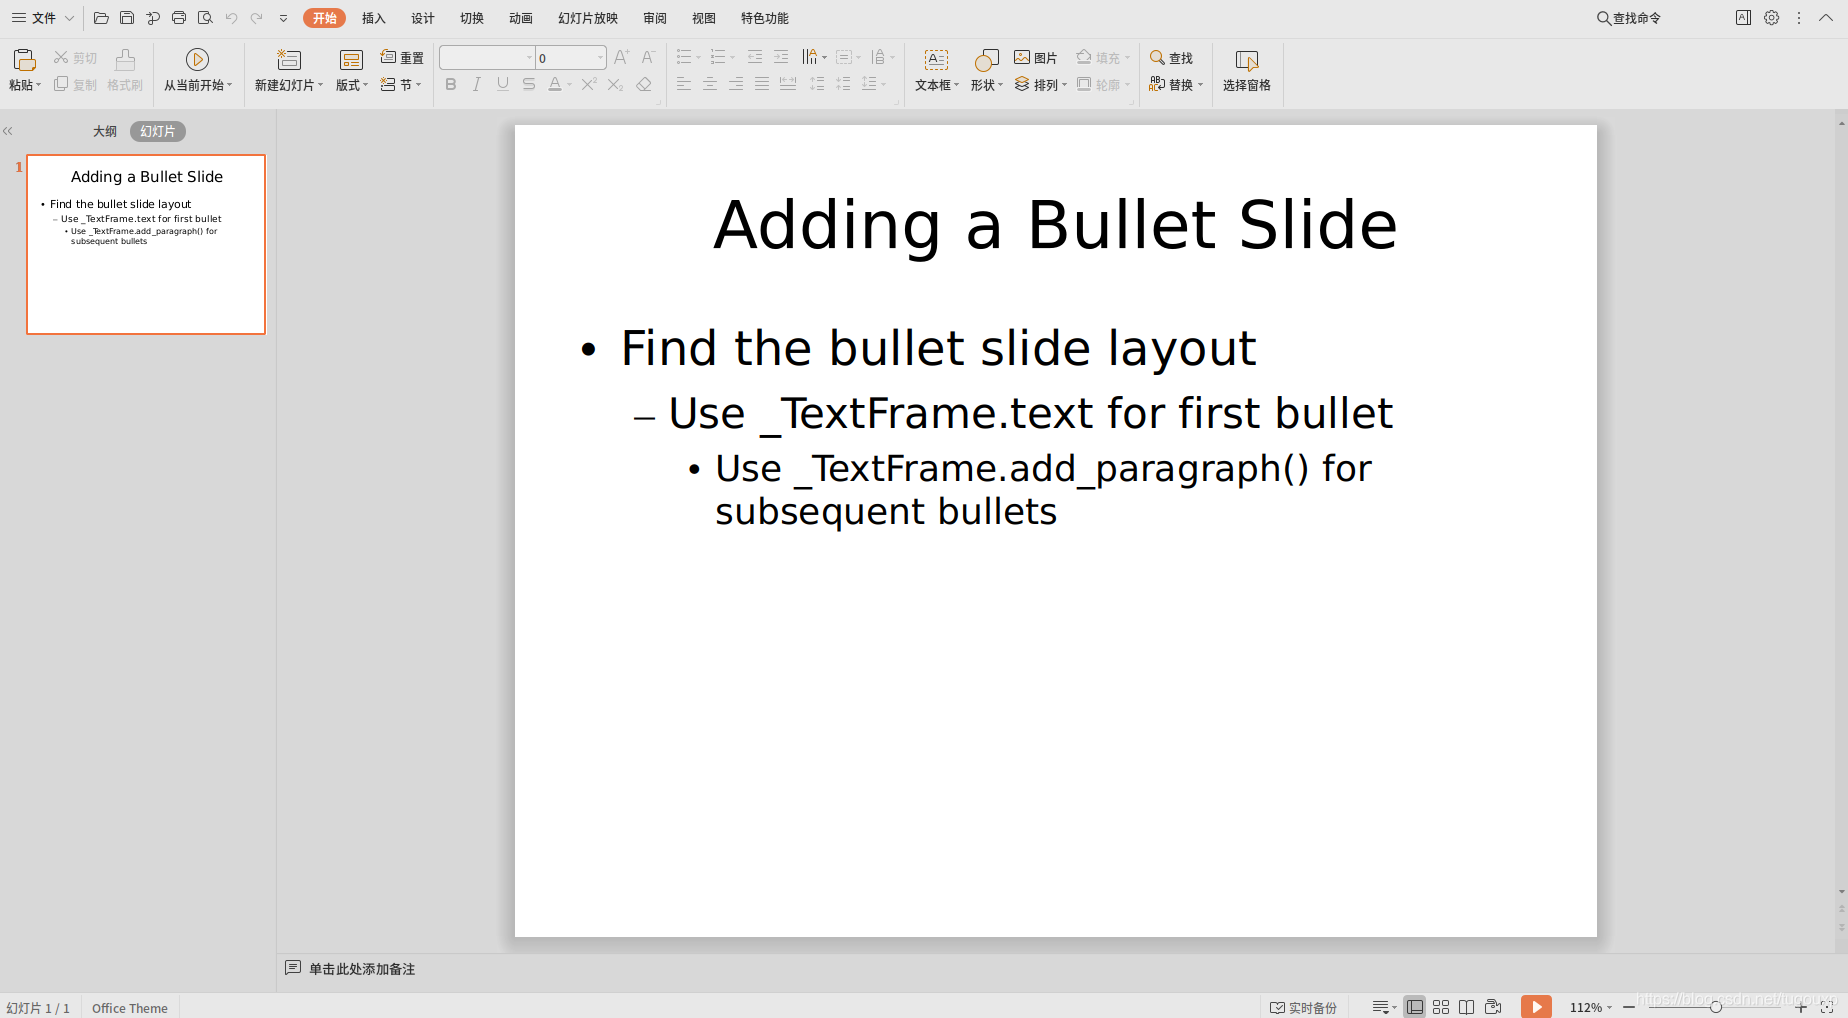
title_shape.text = 'Adding a Bullet Slide'
tf = body_shape.text_frame
tf.text = 'Find the bullet slide layout'
p = tf.add_paragraph()
p.text = 'Use _TextFrame.text for first bullet'
p.level = 1
p = tf.add_paragraph()
p.text = 'Use _TextFrame.add_paragraph() for subsequent bullets'
p.level = 2
prs.save('czl.pptx')
#!/usr/bin/env python3
# -*- coding: utf-8 -*-
from pptx import Presentation
from pptx.enum.shapes import MSO_SHAPE
from pptx.util import Inches
prs = Presentation()
title_only_slide_layout = prs.slide_layouts[5]
slide = prs.slides.add_slide(title_only_slide_layout)
shapes = slide.shapes
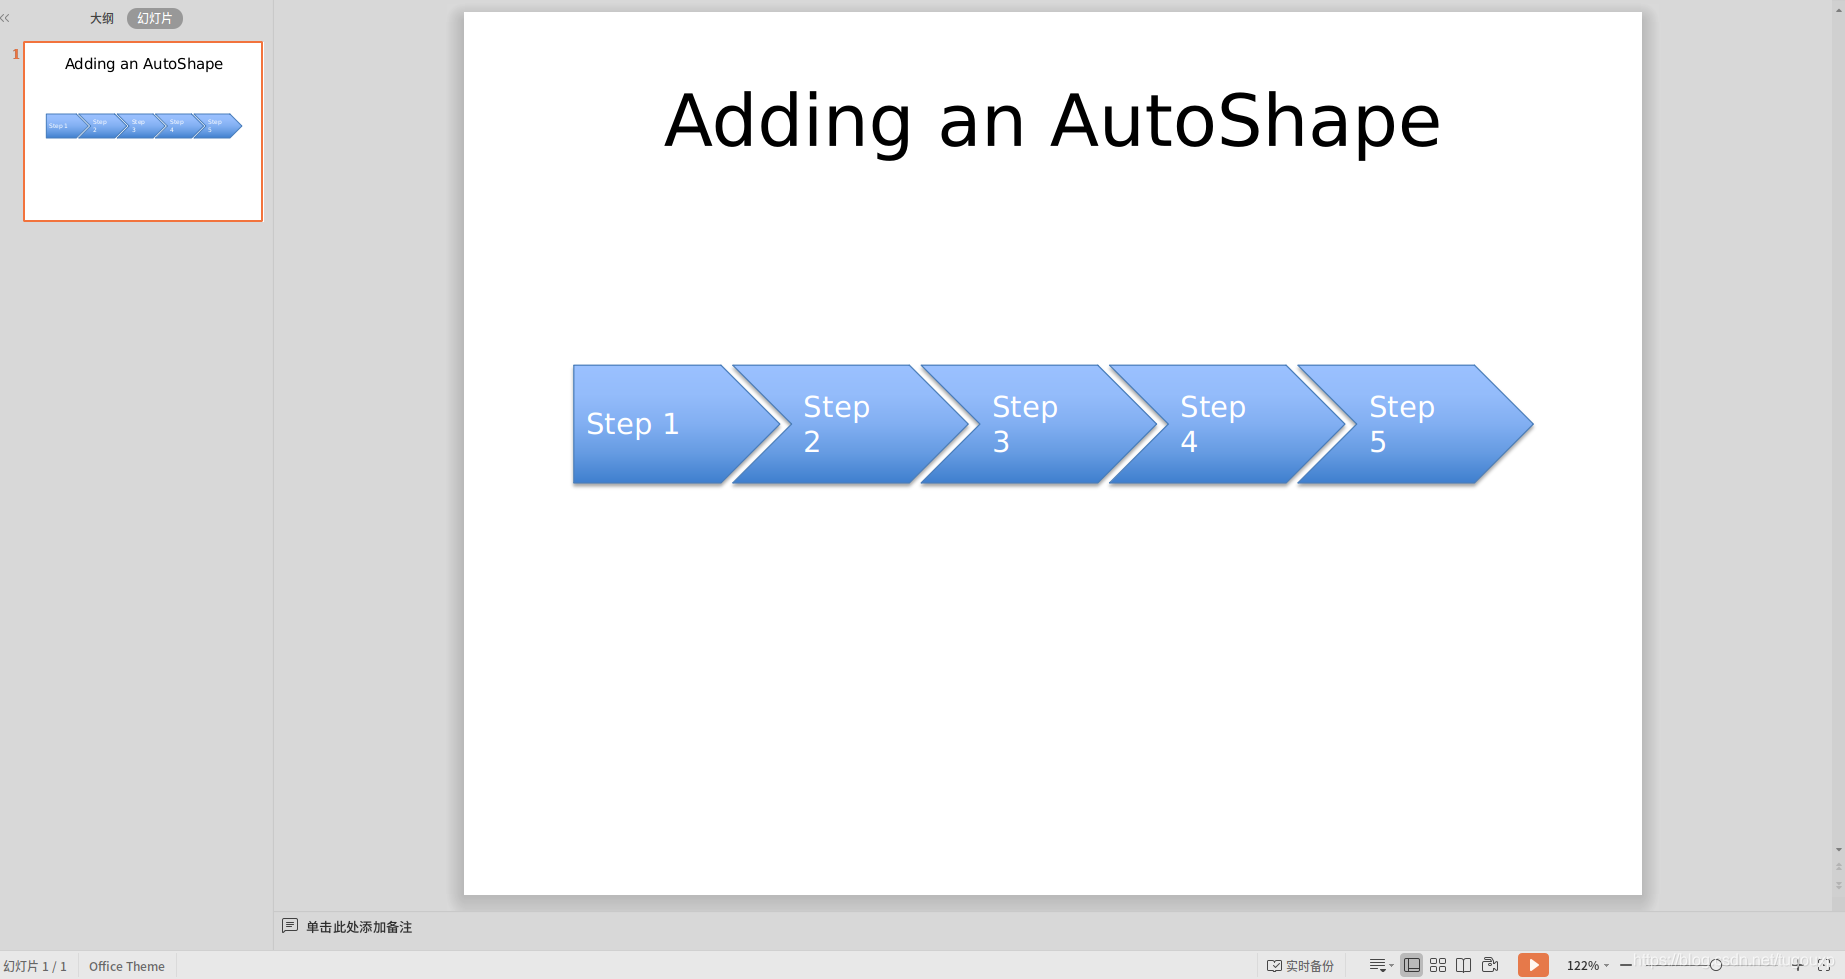
shapes.title.text = 'Adding an AutoShape'
left = Inches(0.93) # 0.93" centers this overall set of shapes
top = Inches(3.0)
width = Inches(1.75)
height = Inches(1.0)
shape = shapes.add_shape(MSO_SHAPE.PENTAGON, left, top, width, height)
shape.text = 'Step 1'
left = left + width - Inches(0.4)
width = Inches(2.0) # chevrons need more width for visual balance
for n in range(2, 6):
shape = shapes.add_shape(MSO_SHAPE.CHEVRON, left, top, width, height)
shape.text = 'Step %d' % n
left = left + width - Inches(0.4)
prs.save('test.pptx')
from pptx import Presentation
from pptx.chart.data import CategoryChartData
from pptx.enum.chart import XL_CHART_TYPE
from pptx.util import Inches
# create presentation with 1 slide ------
prs = Presentation()
slide = prs.slides.add_slide(prs.slide_layouts[5])
# define chart data ---------------------
chart_data = CategoryChartData()
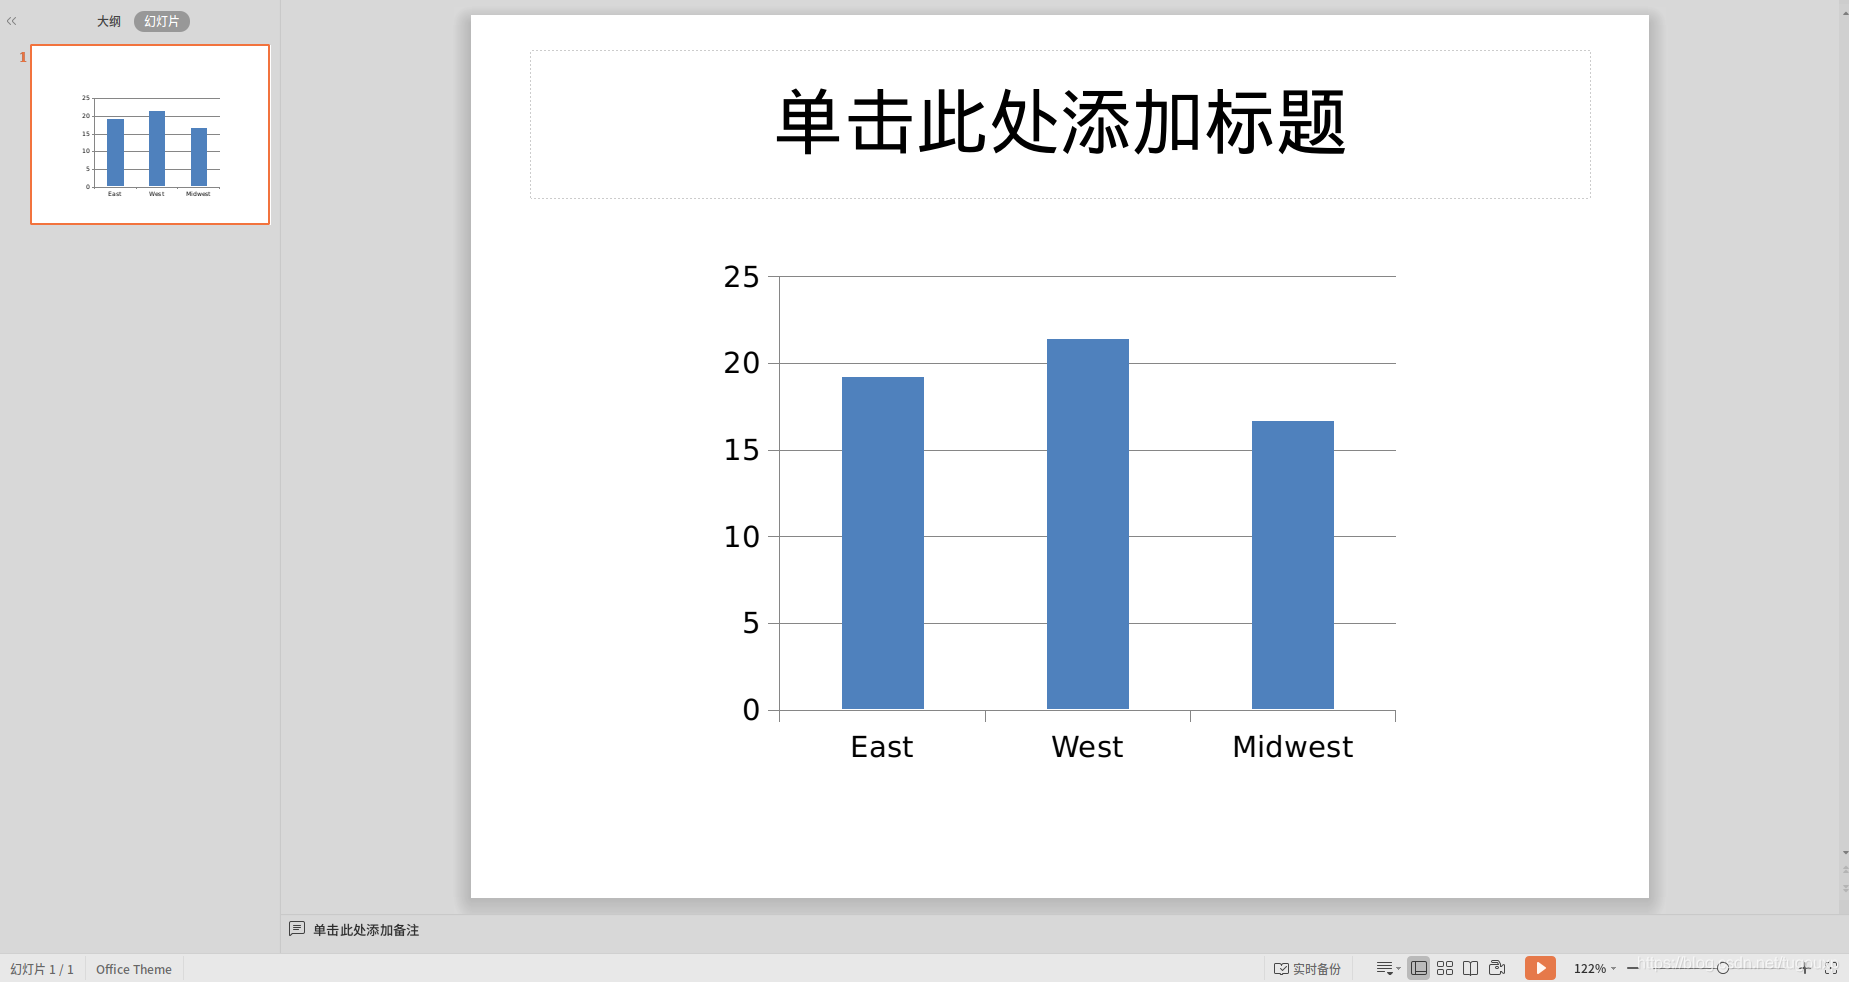
chart_data.categories = ['East', 'West', 'Midwest']
chart_data.add_series('Series 1', (19.2, 21.4, 16.7))
# add chart to slide --------------------
x, y, cx, cy = Inches(2), Inches(2), Inches(6), Inches(4.5)
slide.shapes.add_chart(
XL_CHART_TYPE.COLUMN_CLUSTERED, x, y, cx, cy, chart_data)
prs.save('chart-01.pptx')
from pptx import Presentation
from pptx.util import Inches
from pptx import Presentation
from pptx.chart.data import ChartData
from pptx.enum.chart import XL_CHART_TYPE
from pptx.util import Cm #Inches
from pptx.enum.chart import XL_LEGEND_POSITION
if __name__ == '__main__':
# 创建幻灯片 ------
prs = Presentation('template.pptx')
title_only_slide_layout = prs.slide_layouts[5]
slide = prs.slides.add_slide(title_only_slide_layout)
shapes = slide.shapes
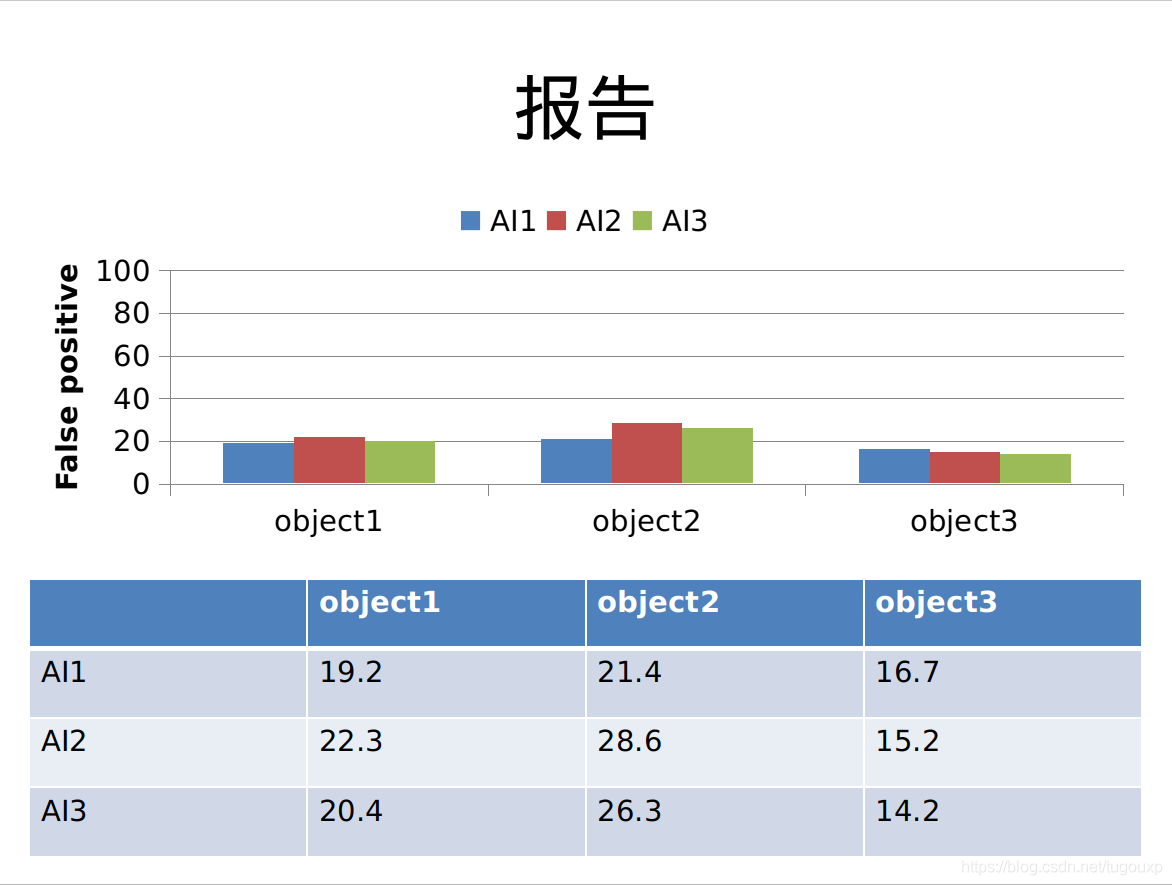
shapes.title.text = '报告'
# 定义表格数据 ------
name_objects = ["object1", "object2", "object3"]
name_AIs = ["AI1", "AI2", "AI3"]
val_AI1 = (19.2, 21.4, 16.7)
val_AI2 = (22.3, 28.6, 15.2)
val_AI3 = (20.4, 26.3, 14.2)
val_AIs = [val_AI1, val_AI2, val_AI3]
# 表格样式 --------------------
rows = 4
cols = 4
top = Cm(12.5)
left = Cm(3.5) #Inches(2.0)
width = Cm(24) # Inches(6.0)
height = Cm(6) # Inches(0.8)
# 添加表格到幻灯片 --------------------
table = shapes.add_table(rows, cols, left, top, width, height).table
# 设置单元格宽度
table.columns[0].width = Cm(6)# Inches(2.0)
table.columns[1].width = Cm(6)
table.columns[2].width = Cm(6)
table.columns[3].width = Cm(6)
# 设置标题行
table.cell(0, 1).text = name_objects[0]
table.cell(0, 2).text = name_objects[1]
table.cell(0, 3).text = name_objects[2]
# 填充数据
table.cell(1, 0).text = name_AIs[0]
table.cell(1, 1).text = str(val_AI1[0])
table.cell(1, 2).text = str(val_AI1[1])
table.cell(1, 3).text = str(val_AI1[2])
table.cell(2, 0).text = name_AIs[1]
table.cell(2, 1).text = str(val_AI2[0])
table.cell(2, 2).text = str(val_AI2[1])
table.cell(2, 3).text = str(val_AI2[2])
table.cell(3, 0).text = name_AIs[2]
table.cell(3, 1).text = str(val_AI3[0])
table.cell(3, 2).text = str(val_AI3[1])
table.cell(3, 3).text = str(val_AI3[2])
# 定义图表数据 ---------------------
chart_data = ChartData()
chart_data.categories = name_objects
chart_data.add_series(name_AIs[0], val_AI1)
chart_data.add_series(name_AIs[1], val_AI2)
chart_data.add_series(name_AIs[2], val_AI3)
# 添加图表到幻灯片 --------------------
x, y, cx, cy = Cm(3.5), Cm(4.2), Cm(24), Cm(8)
graphic_frame = slide.shapes.add_chart(
XL_CHART_TYPE.COLUMN_CLUSTERED, x, y, cx, cy, chart_data
)
chart = graphic_frame.chart
chart.has_legend = True
chart.legend.position = XL_LEGEND_POSITION.TOP
chart.legend.include_in_layout = False
value_axis = chart.value_axis
value_axis.maximum_scale = 100.0
value_axis.has_title = True
value_axis.axis_title.has_text_frame = True
value_axis.axis_title.text_frame.text = "False positive"
value_axis.axis_title.text_frame.auto_size
prs.save('test_template.pptx')
结束后,整理PPT目录,给每个文件加上序号:
caozilong@caozilong-Vostro-3268:~/Workspace/python-ppt$ ls -l *.pptx
-rw-rw-r-- 1 caozilong caozilong 28292 7月  18 16:05 1.template.pptx
-rw-rw-rw- 1 caozilong caozilong   165 7月  18 15:59 2..~test.pptx
-rw-rw-r-- 1 caozilong caozilong 28292 7月  18 16:05 3.czl.pptx
-rw-rw-rw- 1 caozilong caozilong   165 7月  18 15:53 4..~czl.pptx
-rw-rw-r-- 1 caozilong caozilong 35873 7月  18 16:06 5.test_template.pptx
-rw-rw-rw- 1 caozilong caozilong   165 7月  18 16:06 6..~test_template.pptx
caozilong@caozilong-Vostro-3268:~/Workspace/python-ppt$
Python 绘图:
import matplotlib.pyplot as plt
from pylab import *
mpl.rcParams['font.sans-serif'] = ['SimHei']

"""条形图bar"""
x = ['10/Q1', '10/Q3', '11/Q1', '11/Q3', '12/Q1', '12/Q3', '13/Q1', '13/Q3', '14/Q1', '14/Q3', '15/Q1', '15/Q3', '16/Q1', '16/Q3', '17/Q1', '17/Q3']
y = [20, 35, 39, 62, 87, 114, 140, 169, 187, 211, 225, 239, 241, 247, 251, 258]

# plt.bar([1,3,5,7,9],[5,2,7,8,2],label='Example One',color='b')#plt.bar创建条形图
# plt.bar([2,4,6,8,10],[8,6,2,5,6],label='Example Two',color='g')

plt.bar(range(16), y, color = 'lightsteelblue')
plt.plot(range(16), y, marker = 'o', color = 'coral') #coral
plt.xticks(range(16), x)
plt.xlabel('year/month')
plt.ylabel("active customer/month")
plt.legend()
plt.show()

import matplotlib.pyplot as plt
import numpy as np
import matplotlib.patches as mpatches
plt.subplots_adjust(left=0.00, bottom=0.0, right=1.00, top=0.95, wspace=0.0, hspace=0.00)
def hexagon_with_text(ax,x,y,text,size,**kwargs):
xy=np.array([x,y])
hexagon = mpatches.RegularPolygon(xy, 6, radius=size,facecolor='#5472bb',edgecolor='#3f597c', orientation=np.pi / 2)
ax.add_patch(hexagon)
ax.text(xy[0],xy[1],text,fontsize=size*14,color='white',va='center',ha='center')
def circle_with_text(ax,x,y,text,size,**kwargs):
xy=np.array([x,y])
circle = mpatches.Circle(xy, radius=size,facecolor='#83aa51',edgecolor='#546538')
ax.add_patch(circle)
ax.text(xy[0],xy[1],text,fontsize=size*14,color='white',va='center',ha='center')
def arrow(ax,x,y,size,**kwargs):
ax.plot(x,y,**kwargs)
theta=np.arctan2(x[1]-x[0],y[1]-y[0])
xy=np.array([x[1]-size*np.sin(theta),y[1]-size*np.cos(theta)])
triangle = mpatches.RegularPolygon(xy, 3, radius=size,color=kwargs['color'], orientation=-theta)
ax.add_patch(triangle)
def arrow_with_rad(ax,x,y,radius,size,**kwargs):
d=np.sqrt((x[1]-x[0])**2+(y[1]-y[0])**2)
theta=np.arctan2(x[1]-x[0],y[0]-y[1])
x0=(x[0]+x[1])/2+np.cos(theta)*np.sqrt(radius**2-(d/2)**2)
y0=(y[0]+y[1])/2+np.sin(theta)*np.sqrt(radius**2-(d/2)**2)
theta1=np.arctan2(y[0]-y0,x[0]-x0)
theta2=np.arctan2(y[1]-y0,x[1]-x0)
arc_x = []
arc_y = []
for theta in np.arange(theta1,theta2+(np.pi*2),np.pi/180):
temp_x=x0 + radius * np.cos(theta)
temp_y=y0 + radius * np.sin(theta)
if((temp_x-x[0])**2+(temp_y-y[0])**2>1 and (temp_x-x[1])**2+(temp_y-y[1])**2>1):
arc_x.append(temp_x)
arc_y.append(temp_y)
ax.plot(arc_x,arc_y,**kwargs)
theta=np.arctan2(arc_y[-2]-arc_y[-1],arc_x[-2]-arc_x[-1])
xy=np.array([arc_x[-1]+size*np.cos(theta),arc_y[-1]+size*np.sin(theta)])
triangle = mpatches.RegularPolygon(xy, 3, radius=size,color=kwargs['color'], orientation=np.pi/2+theta)
ax.add_patch(triangle)
ax=plt.subplot(1,1,1,aspect='equal')
ax.axis('off')
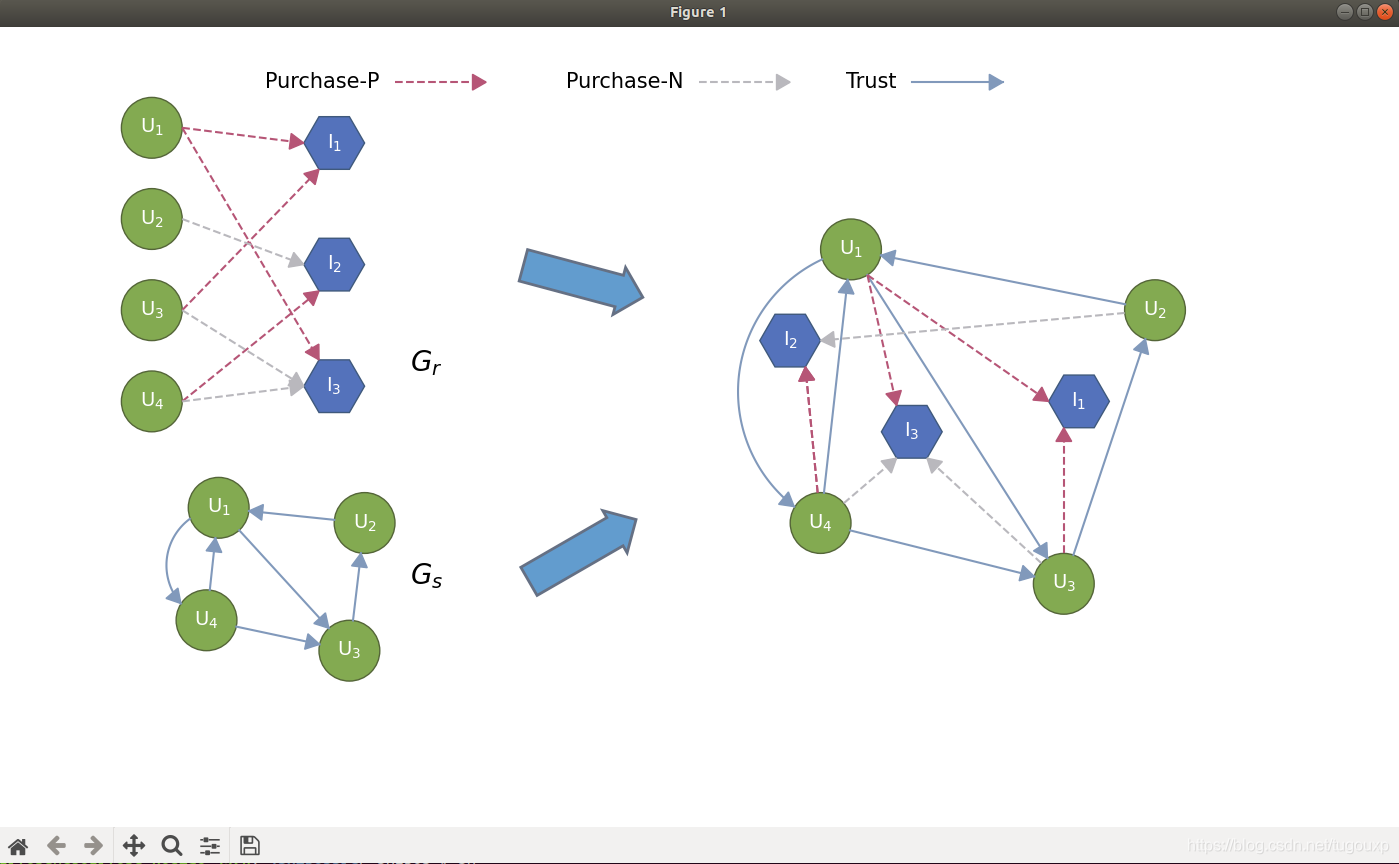
circle_with_text(ax,2,23,'$\mathrm{U_{1}}$',1)
circle_with_text(ax,2,20,'$\mathrm{U_{2}}$',1)
circle_with_text(ax,2,17,'$\mathrm{U_{3}}$',1)
circle_with_text(ax,2,14,'$\mathrm{U_{4}}$',1)
hexagon_with_text(ax,8,22.5,'$\mathrm{I_{1}}$',1)
hexagon_with_text(ax,8,18.5,'$\mathrm{I_{2}}$',1)
hexagon_with_text(ax,8,14.5,'$\mathrm{I_{3}}$',1)
arrow(ax,[3,8+np.cos(np.pi*3/3)],[23,22.5+np.sin(np.pi*3/3)],0.3,color='#b65576',linestyle='--')
arrow(ax,[3,8+np.cos(np.pi*2/3)],[23,14.5+np.sin(np.pi*2/3)],0.3,color='#b65576',linestyle='--')
arrow(ax,[3,8+np.cos(np.pi*4/3)],[17,22.5+np.sin(np.pi*4/3)],0.3,color='#b65576',linestyle='--')
arrow(ax,[3,8+np.cos(np.pi*4/3)],[14,18.5+np.sin(np.pi*4/3)],0.3,color='#b65576',linestyle='--')
arrow(ax,[3,8+np.cos(np.pi*3/3)],[20,18.5+np.sin(np.pi*3/3)],0.3,color='#b9b8bd',linestyle='--')
arrow(ax,[3,8+np.cos(np.pi*3/3)],[17,14.5+np.sin(np.pi*3/3)],0.3,color='#b9b8bd',linestyle='--')
arrow(ax,[3,8+np.cos(np.pi*3/3)],[14,14.5+np.sin(np.pi*3/3)],0.3,color='#b9b8bd',linestyle='--')
ax.text(10.5,15,'${G_{r}}$',fontsize=20)
circle_with_text(ax,4.2,10.5,'$\mathrm{U_{1}}$',1)
circle_with_text(ax,9.0,10.0,'$\mathrm{U_{2}}$',1)
circle_with_text(ax,8.5,5.8,'$\mathrm{U_{3}}$',1)
circle_with_text(ax,3.8,6.8,'$\mathrm{U_{4}}$',1)
theta=-np.pi/2-np.arctan2(9.0-4.2,10.0-10.5)
arrow(ax,[9.0+np.cos(theta),4.2-np.cos(theta)],[10.0+np.sin(theta),10.5-np.sin(theta)],0.3,color='#8199bb')
theta=-np.pi/2-np.arctan2(8.5-9.0,5.8-10.0)
arrow(ax,[8.5+np.cos(theta),9.0-np.cos(theta)],[5.8+np.sin(theta),10.0-np.sin(theta)],0.3,color='#8199bb')
theta=-np.pi/2-np.arctan2(3.8-4.2,6.8-10.5)
arrow(ax,[3.8+np.cos(theta),4.2-np.cos(theta)],[6.8+np.sin(theta),10.5-np.sin(theta)],0.3,color='#8199bb')
theta=-np.pi/2-np.arctan2(3.8-8.5,6.8-5.8)
arrow(ax,[3.8+np.cos(theta),8.5-np.cos(theta)],[6.8+np.sin(theta),5.8-np.sin(theta)],0.3,color='#8199bb')
theta=-np.pi/2-np.arctan2(4.2-8.5,10.5-5.8)
arrow(ax,[4.2+np.cos(theta),8.5-np.cos(theta)],[10.5+np.sin(theta),5.8-np.sin(theta)],0.3,color='#8199bb')
arrow_with_rad(ax,[4.2,3.8],[10.5,6.8],1.9,0.3,color='#8199bb')
ax.text(10.5,8,r'${G_s}$',fontsize=20)
circle_with_text(ax,25.0,19.0,'$\mathrm{U_{1}}$',1)
circle_with_text(ax,35.0,17.0,'$\mathrm{U_{2}}$',1)
circle_with_text(ax,32.0,8.0,'$\mathrm{U_{3}}$',1)
circle_with_text(ax,24.0,10.0,'$\mathrm{U_{4}}$',1)
hexagon_with_text(ax,32.5,14.0,'$\mathrm{I_{1}}$',1)
hexagon_with_text(ax,23.0,16.0,'$\mathrm{I_{2}}$',1)
hexagon_with_text(ax,27.0,13.0,'$\mathrm{I_{3}}$',1)
theta=-np.pi/2-np.arctan2(35.0-25.0,17.0-19.0)
arrow(ax,[35.0+np.cos(theta),25.0-np.cos(theta)],[17.0+np.sin(theta),19.0-np.sin(theta)],0.3,color='#8199bb')
theta=-np.pi/2-np.arctan2(24.0-25.0,10.0-19.0)
arrow(ax,[24.0+np.cos(theta),25.0-np.cos(theta)],[10.0+np.sin(theta),19.0-np.sin(theta)],0.3,color='#8199bb')
theta=-np.pi/2-np.arctan2(24.0-32.0,10.0-8.0)
arrow(ax,[24.0+np.cos(theta),32.0-np.cos(theta)],[10.0+np.sin(theta),8.0-np.sin(theta)],0.3,color='#8199bb')
theta=-np.pi/2-np.arctan2(32.0-35.0,8.0-17.0)
arrow(ax,[32.0+np.cos(theta),35.0-np.cos(theta)],[8.0+np.sin(theta),17.0-np.sin(theta)],0.3,color='#8199bb')
theta=-np.pi/2-np.arctan2(25.0-32.0,19.0-8.0)
arrow(ax,[25.0+np.cos(theta),32.0-np.cos(theta)],[19.0+np.sin(theta),8.0-np.sin(theta)],0.3,color='#8199bb')
theta=-np.pi/2-np.arctan2(24.0-23-np.cos(np.pi*5/3),10.0-16.0-np.sin(np.pi*5/3))
arrow(ax,[24.0+np.cos(theta),23.0+np.cos(np.pi*5/3)],[10.0+np.sin(theta),16.0+np.sin(np.pi*5/3)],0.3,color='#b65576',linestyle='--')
theta=-np.pi/2-np.arctan2(32.0-32.5-np.cos(np.pi*4/3),8.0-14.0-np.sin(np.pi*4/3))
arrow(ax,[32.0+np.cos(theta),32.5+np.cos(np.pi*4/3)],[8.0+np.sin(theta),14.0+np.sin(np.pi*4/3)],0.3,color='#b65576',linestyle='--')
theta=-np.pi/2-np.arctan2(25.0-32.0-np.cos(np.pi*2/3),19.0-8.0-np.sin(np.pi*2/3))
arrow(ax,[25.0+np.cos(theta),27.0+np.cos(np.pi*2/3)],[19.0+np.sin(theta),13.0+np.sin(np.pi*2/3)],0.3,color='#b65576',linestyle='--')
arrow(ax,[25.0+np.cos(theta),32.5+np.cos(np.pi*3/3)],[19.0+np.sin(theta),14.0+np.sin(np.pi*3/3)],0.3,color='#b65576',linestyle='--')
theta=-np.pi/2-np.arctan2(24.0-23-np.cos(np.pi*5/3),10.0-16.0-np.sin(np.pi*5/3))
arrow(ax,[24.0+np.cos(theta),23.0+np.cos(np.pi*5/3)],[10.0+np.sin(theta),16.0+np.sin(np.pi*5/3)],0.3,color='#b65576',linestyle='--')
theta=-np.pi/2-np.arctan2(35.0-23-np.cos(np.pi*0/3),17.0-16.0-np.sin(np.pi*0/3))
arrow(ax,[35.0+np.cos(theta),23.0+np.cos(np.pi*0/3)],[17.0+np.sin(theta),16.0+np.sin(np.pi*0/3)],0.3,color='#b9b8bd',linestyle='--')
theta=-np.pi/2-np.arctan2(24.0-27-np.cos(np.pi*4/3),10.0-13.0-np.sin(np.pi*4/3))
arrow(ax,[24.0+np.cos(theta),27.0+np.cos(np.pi*4/3)],[10.0+np.sin(theta),13.0+np.sin(np.pi*4/3)],0.3,color='#b9b8bd',linestyle='--')
theta=-np.pi/2-np.arctan2(32.0-27-np.cos(np.pi*5/3),8.0-13.0-np.sin(np.pi*5/3))
arrow(ax,[32.0+np.cos(theta),27.0+np.cos(np.pi*5/3)],[8.0+np.sin(theta),13.0+np.sin(np.pi*5/3)],0.3,color='#b9b8bd',linestyle='--')
arrow_with_rad(ax,[25,24],[19,10],4.8,0.3,color='#8199bb')
bbox_props = dict(boxstyle="rarrow,pad=0.3", fc="#629cce", ec="#657084", lw=2)
ax.text(16, 18, " "*15, ha="center", va="center", rotation=345,
size=15,
bbox=bbox_props)
ax.text(16, 9, " "*15, ha="center", va="center", rotation=30,
size=15,
bbox=bbox_props)
arrow(ax,[10,13],[24.5,24.5],0.3,color='#b65576',linestyle='--')
arrow(ax,[20,23],[24.5,24.5],0.3,color='#b9b8bd',linestyle='--')
arrow(ax,[27,30],[24.5,24.5],0.3,color='#8199bb')
ax.text(9.5,24.5,'Purchase-P',fontsize=15,va='center',ha='right')
ax.text(19.5,24.5,'Purchase-N',fontsize=15,va='center',ha='right')
ax.text(26.5,24.5,'Trust',fontsize=15,va='center',ha='right')
fig=plt.gcf()
fig.set_size_inches(14, 8)
ax.set_xlim(0,40)
ax.set_ylim(0,25)
plt.show()
import numpy as np
import matplotlib.pyplot as plt
import matplotlib
# matplotlib.rcParams['font.family'] = 'SimHei'
size = 31
#a = np.random.random(size)
#b = np.random.random(size)
#c = np.random.random(size)
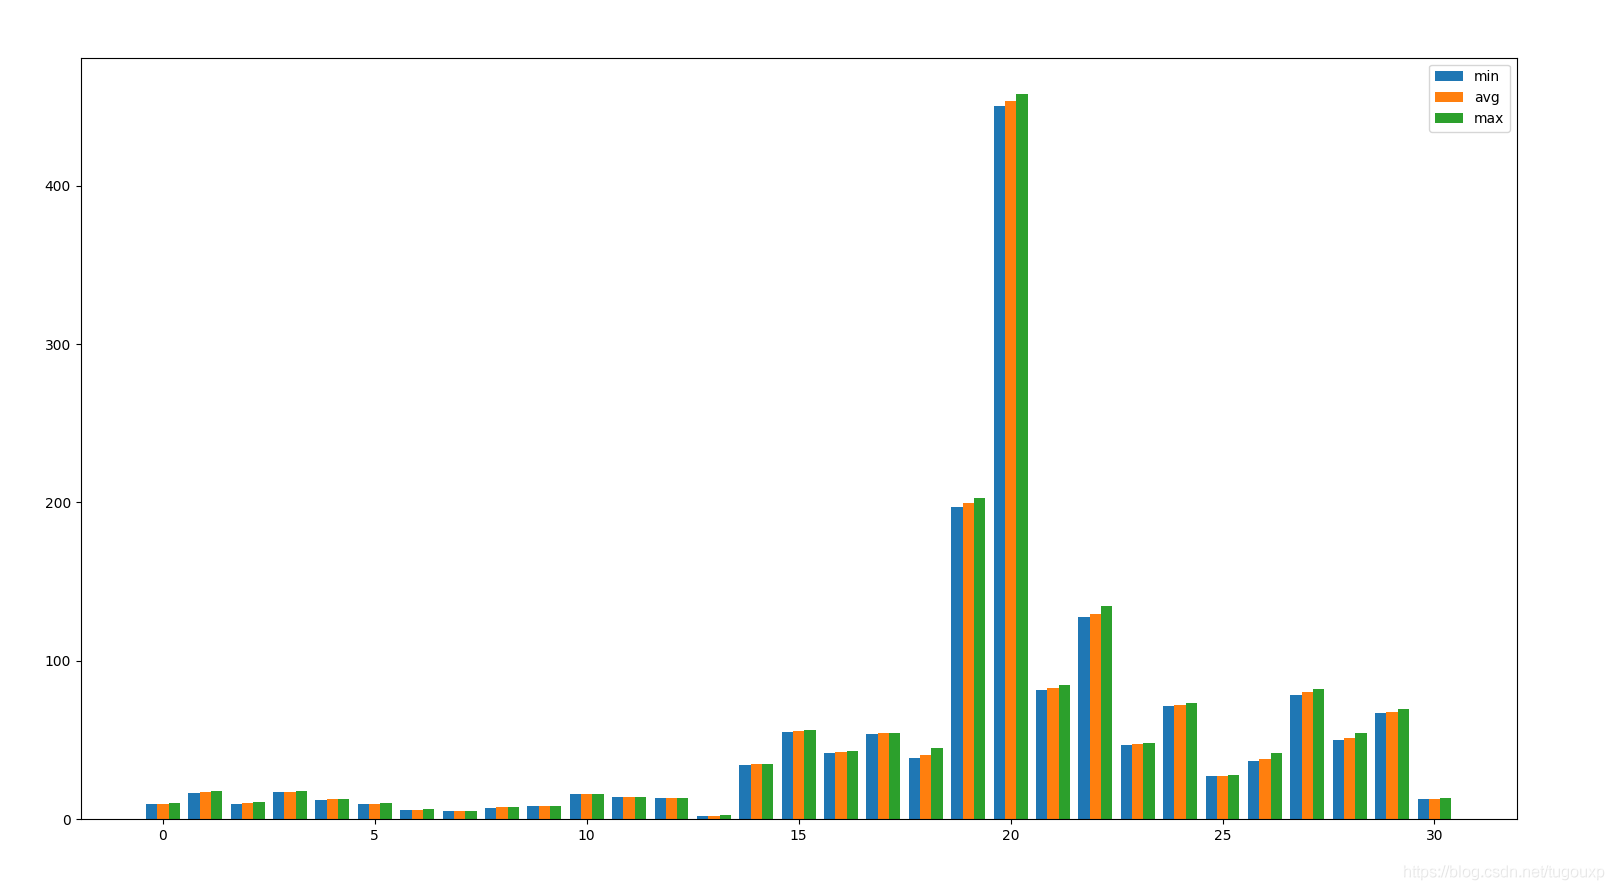
a=[9.30,16.34,9.68,16.96,12.19,9.58,5.65,4.89,7.37,8.44,15.64,14.04,13.30,1.97,34.28,55.18,41.80,53.95,38.84,196.85,450.36,81.79,127.43,46.91,71.44,27.21,36.85,78.30,49.91,66.96, 12.82]
b=[9.81,17.11,10.14,17.32,12.45,9.79,5.88,4.95,7.55,8.50,15.72,14.12,13.38,2.19,34.60,55.86,42.37,54.20,40.75,199.53,453.62,82.92,129.45,47.41,71.99,27.51,38.16,80.26,51.22,67.78,13.05]
c=[10.36,17.89,10.90,17.95,12.66,9.96,6.27,5.08,7.72,8.57,15.86,14.25,13.45,2.49,35.10,56.48,43.28,54.31,45.25,202.48,457.89,84.69,134.42,48.25,73.19,28.00,41.69,82.51,54.61,69.62,13.19]
x = np.arange(size)
total_width, n = 0.8, 3
width = total_width / n
str1 = ("squeezenet", "squeezenet_int8", "mobilenet", "mobilenet_int8", "mobilenet_v2", "mobilenet_v3", "shufflenet", "shufflenet_v2", "mnasnet", "proxylessnasnet", "efficientnet_b0", "efficientnetv2_b0", "regnety_400m", "blazeface", "googlenet", "googlenet_int8", "resnet18", "resnet18_int8", "alexnet", "vgg16", "vgg16_int8", "resnet50","resnet50_int8", "squeezenet_ssd","squeezenet_ssd_int8", "mobilenet_ssd","mobilenet_ssd_int8", "mobilenet_yolo", "mobilenetv2_yolov3","yolov4-tiny", "nanodet_m")
x = x - (total_width - width) / 2
#plt.bar(x, a, width=width, label='min',tick_label=str1)
#plt.bar(x+width, b, width=width, label='avg', tick_label=str1)
#plt.bar(x+2*width, c, width=width, label='max',tick_label=str1)
plt.bar(x, a, width=width, label='min')
plt.bar(x+width, b, width=width, label='avg')
plt.bar(x+2*width, c, width=width, label='max')
#for a, b in zip(x, b):
# plt.text(a, b + 0.05, '%.0f' % b, ha='center', va='bottom', fontsize=10)
plt.legend()
plt.show()
总结
到此这篇关于利用Python制作PPT的文章就介绍到这了,更多相关Python制作PPT内容请搜索脚本之家以前的文章或继续浏览下面的相关文章希望大家以后多多支持脚本之家!
相关文章
 这篇文章主要介绍了在pycharm中实现查看某一函数源码的快捷键,具有很好的参考价值,希望能给大家做个参考,如有错误或未考虑完全的地方,望不吝赐教2021-05-05
 下面小编就为大家带来一篇python 读写、创建 文件的方法(必看)。小编觉得挺不错的,现在就分享给大家,也给大家做个参考。一起跟随小编过来看看吧2016-09-09
 这篇文章主要介绍了python tqdm库的使用,帮助大家更好的理解和学习python,感兴趣的朋友可以了解下2020-11-11
 这篇文章主要介绍了Python进程通信之匿名管道实例讲解,本文直接给出代码实例,代码中包含详细注释,需要的朋友可以参考下2015-04-04
python使用paramiko模块实现ssh远程登陆上传文件并执行
使用paramiko,ssh远程登陆,长传文件并执行。其中用到了多线程和队列,paramiko是用python语言写的一个模块,遵循SSH2协议,支持以加密和认证的方式,进行远程服务器的连接。2014-01-01 今天小编就为大家分享一篇对Tensorflow中Device实例的生成和管理详解,具有很好的参考价值,希望对大家有所帮助。一起跟随小编过来看看吧2020-02-02
 Python的虚拟环境可以帮助我们在同一台机器上,同时使用不同的Python版本和库,方便管理和开发,下面这篇文章主要给大家介绍了关于Python虚拟环境venv的相关资料,需要的朋友可以参考下2023-06-06
 这篇文章主要介绍了浅谈Django的缓存机制,小编觉得挺不错的,现在分享给大家,也给大家做个参考。一起跟随小编过来看看吧2018-08-08
 这篇文章主要介绍了Python实现生成随机数据插入mysql数据库的方法,涉及Python随机字符串生成及数据库连接、插入等相关操作技巧,需要的朋友可以参考下2017-12-12
 RSA加密算法是一种强大的公钥加密算法,安全性很高,这里我们来看一下Python使用Pycrypto库进行RSA加密的方法详解,需要的朋友可以参考下2016-06-06


最新评论