
Vue3使用echarts绘制特殊样式的折线图和柱状图
更新时间:2024年02月05日 16:40:55 作者:coderSlow
这篇文章主要为大家详细介绍了Vue3如何使用echarts实现绘制一些特殊样式的折线图和柱状图,文中的示例代码讲解详细,需要的小伙伴可以了解下
案例1
(1)效果
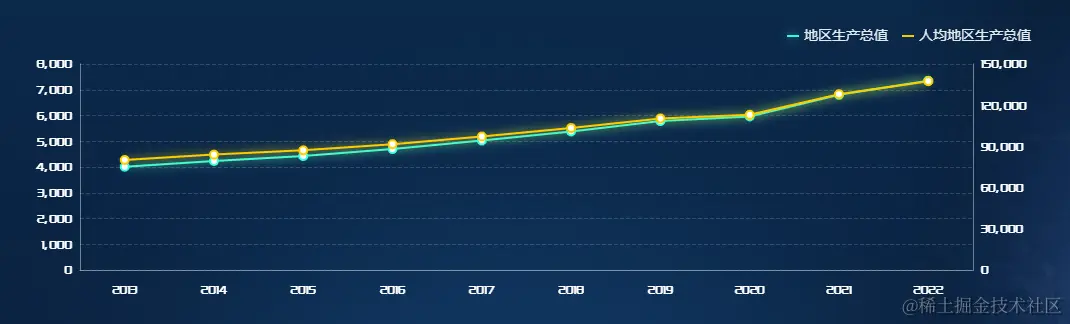
(2)代码
 <div class="left-one-bottom">
    <div id="left-echarts-one-id" />
 </div>
<script lang="ts" setup>
import { defineComponent, ref, reactive, onMounted, onUnmounted, getCurrentInstance } from 'vue'
import { get10YearTrend } from '@/script/api/core'
let yearData: any = [] // 年份
let areaData: any = [] // 地区生产总值
let perCapitaData: any = [] // 人均地区生产总值
const getData = () => {
  // 这个方法用于请求数据+渲染echarts
  get10YearTrend({}).then((res: any) => {
    if (res.code == 200) {
      res.data.forEach((element: any) => {
        yearData.push(element.year)
        areaData.push(element.gdp)
        perCapitaData.push(element.perCapitaRegionalGdp)
      })
      echartsRend()
    }
  })
}
// 获取当前组件实例
const { proxy }: any = getCurrentInstance()
const echartsRend = () => {
  // 获取echart挂载的DOM节点
  const container = ref(document.querySelector('#left-echarts-one-id'))
  // echarts初始化
  let myChart = proxy.$echarts.init(container.value)
  const option = {
    legend: {
      show: true,
      left: 'right',
      selectedMode: false,
      textStyle: {
        // 图例文字样式属性
        color: 'rgba(255, 255, 255, 0.9)', // 字体颜色
        fontSize: 14, // 字体大小
        align: 'left', // 水平对齐方式为左对齐
      },
      itemHeight: 2,
      itemWidth: 12,
      itemGap: 14,
      data: [
        {
          name: '地区生产总值',
          // 强制设置图形为圆。
          icon: 'rect',
          itemStyle: {
            color: 'rgba(51, 255, 221, 1)',
            borderColor: 'rgba(51, 255, 221, 1)',
            shadowColor: 'rgba(51, 255, 221, .8)',
            shadowBlur: 10,
          },
        },
        {
          name: '人均地区生产总值',
          // 强制设置图形为圆。
          icon: 'rect',
        },
      ],
    },
    // 直角坐标系内绘图网格
    grid: {
      show: false, // 是否显示直角坐标系网格,外边框
      top: '40', // 离容器左侧的距离
      right: '10', // 离容器上侧的距离
      left: '10', // 离容器左侧的距离
      bottom: '0', // 离容器底部的距离
      borderColor: '#ff0', // 外边框颜色
      containLabel: true, // 是否包含坐标轴的刻度标签,默认为false;true时防止标签溢出
    },
    // 提示框组件
    tooltip: {
      trigger: 'axis', // 触发类型,axis:坐标轴触发
      axisPointer: {
        // 坐标轴指示器配置项
        type: 'shadow', // 指示器类型:line、shadow、none、cross
        shadowStyle: {
          color: 'rgba(216, 216, 216, 0.1)',
        },
      },
      backgroundColor: 'rgba(216, 216, 216, 0.1)', // 提示框浮层的背景颜色
      borderColor: 'rgba(216, 216, 216, 0.1)', // 提示框浮层的边框颜色
      textStyle: {
        color: '#B1DEFF',
        fontSize: '24',
        fontFamily: 'PangMenZhengDao',
      },
      formatter: function (params: any) {
        // 2.回调函数,可return dom 自定义样式
        // console.log('params', params)
        return (
          params[0].name +
          '年<br>' +
          '<div style="display:flex;align-items: center;"><span style="background-color:rgba(51, 255, 221, 1);display: inline-block;width: 8px;height: 2px;margin-right: 4px;"></span>' +
          params[0].seriesName +
          ':<span style="color: #fff;margin-right:6px;">' +
          params[0].value +
          '</span>' +
          '<span style="font-size:14px;color: #B1DEFF;">亿元</span></div>' +
          '<div style="display:flex;align-items: center;"><span style="background-color:rgba(255, 204, 0, 1);display: inline-block;width: 8px;height: 2px;margin-right: 4px;"></span>' +
          params[1].seriesName +
          ':<span style="color: #fff;margin-right:6px;">' +
          params[1].value +
          '</span>' +
          '<span style="font-size:14px;color: #B1DEFF;">元/人</span></div>'
        )
      },
    },
    // 图表背景色
    backgroundColor: 'transparent',
    // x 轴设置
    xAxis: [
      {
        type: 'category',
        nameLocation: 'end', // X轴名称位置
        nameTextStyle: {
          // X轴名称样式
          color: '#fff',
          fontWeight: 'bold',
        },
        nameGap: 10, // X轴名称与轴线之间的距离
        nameRotate: 0, // 坐标轴名称旋转
        axisLabel: {
          // X轴类目名称样式
          // interval: 'auto',
          verticalAlign: 'middle',
          lineHeight: 16,
          margin: 20,
          color: '#fff',
          fontSize: 12,
          fontFamily: 'PangMenZhengDao',
          rotate: 0,
        },
        axisLine: {
          // X轴轴线设置
          show: true,
          lineStyle: {
            color: 'rgba(216, 216, 216, 0.5)',
            width: 1,
          },
        },
        axisTick: {
          // X轴刻度相关设置
          show: false,
        },
        splitLine: {
          // 横向分隔线
          show: false,
        },
        axisPointer: {
          type: 'line',
          lineStyle: {
            color: 'rgba(216, 216, 216, 0.1)',
            type: 'solid',
            width: 37,
          },
        },
        // 类目数据
        data: yearData,
      },
    ],
    // y轴设置
    yAxis: [
      {
        min: 0, // 坐标轴刻度最小值
        axisLine: {
          // y轴轴线设置
          show: true,
          lineStyle: {
            color: 'rgba(216, 216, 216, 0.5)',
            width: 1,
          },
        },
        axisLabel: {
          // y轴刻度标签
          formatter: '{value}',
          inside: false, // 刻度标签是否朝内,默认朝外
          textStyle: {
            color: 'rgba(255, 255, 255, 1)',
            fontSize: 12,
            fontFamily: 'PangMenZhengDao',
          },
        },
        axisTick: {
          // 刻度设置
          show: false,
        },
        splitLine: {
          // 纵向分隔线
          show: true,
          lineStyle: {
            color: 'rgba(216, 216, 216, 0.2)',
            type: 'dashed',
          },
        },
      },
      {
        type: 'value',
        // min: 0,
        // max: 100,
        // splitNumber: 5,
        // interval: 20,
        splitLine: {
          show: false,
          lineStyle: {
            type: 'solid',
            color: 'rgba(216, 216, 216, .2)',
          },
        },
        axisLine: {
          // y轴轴线设置
          show: true,
          lineStyle: {
            color: 'rgba(216, 216, 216, 0.5)',
            width: 1,
          },
        },
        axisLabel: {
          show: true,
          formatter: '{value}',
          textStyle: {
            color: 'rgba(255,255,255, 1)',
            fontSize: 12,
            fontFamily: 'PangMenZhengDao',
          },
        },
      },
    ],
    series: [
      {
        name: '地区生产总值',
        type: 'line',
        markPoint: 'arrow',
        lineStyle: {
          shadowColor: 'rgba(51, 255, 221, 1)', // 设置阴影颜色
          shadowBlur: 10, // 设置阴影的模糊大小
        },
        itemStyle: {
          normal: {
            color: 'rgba(51, 255, 221, 1)',
          },
        },
        symbolSize: 8,
        data: areaData,
      },
      {
        type: 'line',
        yAxisIndex: 1,
        name: '人均地区生产总值',
        lineStyle: {
          shadowColor: 'rgba(255, 204, 0, 1)', // 设置阴影颜色
          shadowBlur: 10, // 设置阴影的模糊大小
          // shadowOffsetX: 0, // 设置阴影沿X轴的偏移量
          // shadowOffsetY: 3 // 设置阴影沿y轴的偏移量
        },
        itemStyle: {
          normal: {
            color: 'rgba(255, 204, 0, 1)',
          },
        },
        symbolSize: 8,
        data: perCapitaData,
      },
    ],
  }
  myChart.setOption(option)
  // 根据页面大小自动响应图表大小
  window.addEventListener('resize', function () {
    myChart.resize()
  })
}
onMounted(() => {
  getData() // 使用方法放在onMounted中
})
</script>
<style lang="scss" scoped>
.left-one-bottom {
  width: 1005px;
  height: 282px;
  margin: 0 auto;
  #left-echarts-one-id {
    width: 100%;
    height: 100%;
  }
}
</style>
案例2
(1)效果
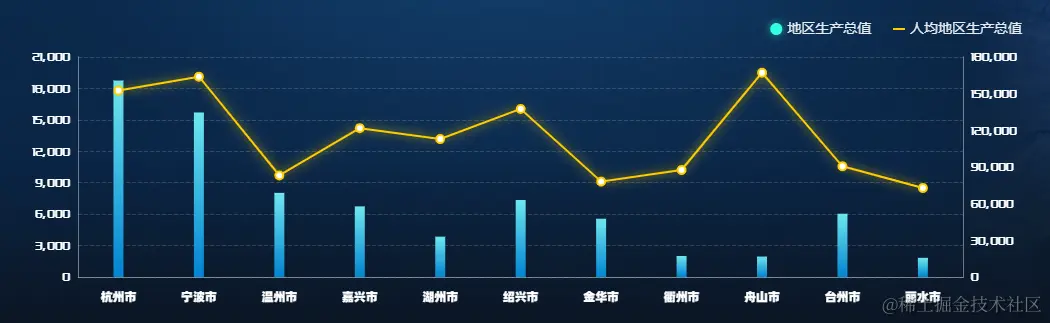
(2)代码
<div class="left-two-bottom">
    <div id="left-echarts-two-id" />
</div>
 <script lang="ts" setup>
  import { defineComponent, ref, reactive, onMounted, onUnmounted, getCurrentInstance } from 'vue'
  import { getZjCityTrend } from '@/script/api/core'
  let cityName:any = [] // 城市
  let areaData:any = [] // 地区生产总值
  let perCapitaData:any = [] // 人均地区生产总值
  const getData = () => { // 这个方法用于请求数据+渲染echarts
    getZjCityTrend({}).then((res:any) =>{
        if(res.code == 200){
            // console.log(res)
            res.data.forEach((element:any) => {
                cityName.push(element.city)
                areaData.push(element.gdp)
                perCapitaData.push(element.perCapitaRegionalGdp)
            })
            echartsRend()
        }
    })
  }
  // 获取当前组件实例
  const { proxy }: any = getCurrentInstance();
  const echartsRend = () => {
      // 获取echart挂载的DOM节点
      const container = ref(document.querySelector('#left-echarts-two-id'));
    // echarts初始化
	let myChart = proxy.$echarts.init(container.value);
    const option = {
        legend: [{
            show: true,
            right: '15%',
            selectedMode: false,
            textStyle: { // 图例文字样式属性
                color: 'rgba(255, 255, 255, 0.9)', // 字体颜色
                fontSize: 14, // 字体大小
                align: 'left' // 水平对齐方式为左对齐
            },
            itemHeight: 12,
            itemWidth: 12,
            itemGap: 14,
            data: [{
                name: '地区生产总值',
                // 强制设置图形为圆。
                icon: 'circle',
                itemStyle: {
                    color: 'rgba(51, 255, 221, 1)',
                    borderColor: 'rgba(51, 255, 221, 1)',
                    shadowColor: 'rgba(51, 255, 221, .6)',
                    shadowBlur: 10
                }
            }]
        },{
            show: true,
            right: '0%',
            selectedMode: false,
            textStyle: { // 图例文字样式属性
                color: 'rgba(255, 255, 255, 0.9)', // 字体颜色
                fontSize: 14, // 字体大小
                align: 'left' // 水平对齐方式为左对齐
            },
            itemHeight: 2,
            itemWidth: 12,
            itemGap: 14,
            data: [{
                name: '人均地区生产总值',
                // 强制设置图形为圆。
                icon: 'rect'
            }]
        },],
        // 直角坐标系内绘图网格
        grid: {
            show: false, // 是否显示直角坐标系网格,外边框
            top: '40', // 离容器左侧的距离
            right: '10', // 离容器上侧的距离
            left: '10', // 离容器左侧的距离
            bottom: '0', // 离容器底部的距离
            borderColor: '#ff0', // 外边框颜色
            containLabel: true // 是否包含坐标轴的刻度标签,默认为false;true时防止标签溢出
        },
        // 提示框组件
        tooltip: {
            trigger: 'axis', // 触发类型,axis:坐标轴触发
            axisPointer: {
                // 坐标轴指示器配置项
                type: 'shadow', // 指示器类型:line、shadow、none、cross
                shadowStyle: {
                    color: 'rgba(216, 216, 216, 0.1)'
                } // 指示器类型:line、shadow、none、cross
            },
            backgroundColor: 'rgba(216, 216, 216, 0.1)', // 提示框浮层的背景颜色
            borderColor: 'rgba(216, 216, 216, 0.1)', // 提示框浮层的边框颜色
            textStyle: {
                color: '#B1DEFF',
                fontSize: '24',
                fontFamily:'PangMenZhengDao',
            },
            formatter: function (params:any) {
                // 2.回调函数,可return dom 自定义样式
                // console.log('params', params)
                return (
                   '<div style="font-family:Alibaba2;font-weight: 800; ">'+params[0].name + '</div>' +
                  '<div style="display:flex;align-items: center;"><span style="background-color:rgba(51, 255, 221, 1);display: inline-block;width: 8px;height: 8px;border-radius: 50%;margin-right: 4px;"></span>' + params[0].seriesName +':<span style="color: #fff;margin-right:6px;">'+ params[0].value + '</span>' + '<span style="font-size:14px;color: #B1DEFF;">亿元</span></div>'+
                  '<div style="display:flex;align-items: center;"><span style="background-color:rgba(255, 204, 0, 1);display: inline-block;width: 8px;height: 2px;margin-right: 4px;"></span>' + params[1].seriesName +':<span style="color: #fff;margin-right:6px;">'+ params[1].value + '</span>' + '<span style="font-size:14px;color: #B1DEFF;">元/人</span></div>'
                )
            }
        },
        // 图表背景色
        backgroundColor: 'transparent',
        // x 轴设置
        xAxis: [
            {
                type: 'category',
                nameLocation: 'end', // X轴名称位置
                nameTextStyle: {
                // X轴名称样式
                color: '#fff',
                fontWeight: 'bold'
                },
                nameGap: 10, // X轴名称与轴线之间的距离
                nameRotate: 0, // 坐标轴名称旋转
                axisLabel: {
                    // X轴类目名称样式
                    // interval: 'auto',
                    verticalAlign: 'middle',
                    lineHeight: 16,
                    margin: 20,
                    color: '#fff',
                    fontSize: 12,
                    fontFamily:'Alibaba2',
                    fontWeight: '800',
                    rotate: 0,
                },
                axisLine: {
                    // X轴轴线设置
                    show: true,
                    lineStyle: {
                        color: 'rgba(216, 216, 216, 0.5)',
                        width: 1
                    }
                },
                axisTick: {
                    // X轴刻度相关设置
                    show: false
                },
                splitLine: {
                    // 横向分隔线
                    show: false
                },
                axisPointer: {
                    type: "line",
                    lineStyle: {
                        color: "rgba(216, 216, 216, 0.1)",
                        type: "solid",
                        width: 37,
                    },
                },
                // 类目数据
                data: cityName
            }
        ],
        // y轴设置
        yAxis: [
        {
            // type: 'value',
            // position: 'left',
            // name:'单位:亿元',
            // nameTextStyle: {
            //     color: 'rgba(255, 255, 255, 0.8)',
            //     fontSize: 14,
            //     fontWeight: 'bold'
            // },
            min: 0, // 坐标轴刻度最小值
            axisLine: {
                // y轴轴线设置
                show: true,
                lineStyle: {
                    color: 'rgba(216, 216, 216, 0.5)',
                    width: 1
                }
            },
            axisLabel: {
                // y轴刻度标签
                formatter: '{value}',
                inside: false, // 刻度标签是否朝内,默认朝外
                textStyle: {
                    color: 'rgba(255, 255, 255, 1)',
                    fontSize: 12,
                    fontFamily:'PangMenZhengDao'
                }
            },
            axisTick: {
                // 刻度设置
                show: false
            },
            splitLine: {
                // 纵向分隔线
                show: true,
                lineStyle: {
                    color: 'rgba(216, 216, 216, 0.2)',
                    type: 'dashed'
                }
            }
        },
          {
            type: 'value',
            splitLine: {
              show: false,
              lineStyle: {
                type: "solid",
                color: "rgba(216, 216, 216, .2)"
              }
            },
            axisLine: {
                // y轴轴线设置
                show: true,
                lineStyle: {
                    color: 'rgba(216, 216, 216, 0.5)',
                    width: 1
                }
            },
            axisLabel: {
              show: true,
              formatter: '{value}',
              textStyle: {
                color: "rgba(255,255,255, 1)",
                fontSize: 12,
                fontFamily:'PangMenZhengDao'
              }
            }
          }
        ],
        series: [
            {
                name: '地区生产总值',
                type: 'bar',
                barWidth: 10,
                markPoint: 'arrow',
                itemStyle: {
                color: new proxy.$echarts.graphic.LinearGradient(
                    0,
                    0,
                    0,
                    1,
                    [
                    {
                        offset: 0,
                        color: 'rgba(110, 230, 240, 1)'
                    },
                    {
                        offset: 1,
                        color: 'rgba(0, 131, 210, 1)'
                    }
                    ],
                    false
                )
                },
                data: areaData
            },
            {
              type: 'line',
              yAxisIndex: 1,
              name: '人均地区生产总值',
              lineStyle: {
                    shadowColor: 'rgba(255, 204, 0, 1)', // 设置阴影颜色
                    shadowBlur: 10 // 设置阴影的模糊大小
                },
              itemStyle: {
                normal: {
                  color: 'rgba(255, 204, 0, 1)'
                }
              },
              symbolSize: 8,
              data: perCapitaData
            }
        ]
    }
    myChart.setOption(option);
    // 根据页面大小自动响应图表大小
	window.addEventListener("resize", function () {
	    myChart.resize();
	});
  }
  onMounted(() => {
    getData()
  });
</script>
<style lang="scss" scoped>
.left-two-bottom {
    width: 1005px;
    height: 296px;
    margin: 0 auto;
    #left-echarts-two-id {
        width: 100%;
        height: 100%;
    }
}
</style>
案例3
(1)效果
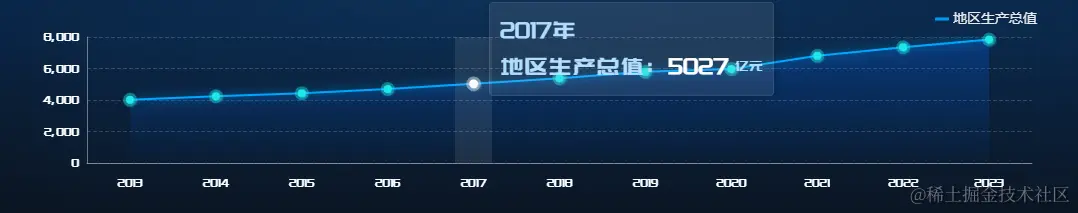
(2)代码
<div class="right-two-box">
    <div id="right-echarts-two-id" />
</div>
 <script lang="ts" setup>
  import { defineComponent, ref, reactive, onMounted, onUnmounted, getCurrentInstance } from 'vue'
  import { getPredictiveAnalysis } from '@/script/api/core'
  let yearData: any = [] // 年份
  let areaData: any = [] // 地区生产总值
  let timeType:String = '' // 用于判断是年还是季度
  const getData = () => {
    // 这个方法用于请求数据+渲染echarts
  getPredictiveAnalysis({}).then((res: any) => {
    if (res.code == 200) {
        // console.log(res)
        res.data.forEach((element: any) => {
            yearData.push(element.time)
            areaData.push(element.value)
            timeType = element.unit
        })
        echartsRend()
    }
  })
    }
    // 获取当前组件实例
    const { proxy }: any = getCurrentInstance();
    const echartsRend = () => {
    // 获取echart挂载的DOM节点
    const container = ref(document.querySelector('#right-echarts-two-id'));
    // echarts初始化
    let myChart = proxy.$echarts.init(container.value);
    const option = {
        legend: {
            show: true,
            left: 'right',
            selectedMode: false,
            textStyle: { // 图例文字样式属性
                color: 'rgba(255, 255, 255, 0.9)', // 字体颜色
                fontSize: 14, // 字体大小
                align: 'left' // 水平对齐方式为左对齐
            },
            itemHeight: 1,
            itemWidth: 12,
            itemGap: 14,
            data: [{
                name: '地区生产总值',
                // 强制设置图形为方。
                icon: 'rect',
                itemStyle: {
                    color: 'rgba(0, 152, 250, 1)',
                    borderColor: 'rgba(0, 152, 250, 1)'
                }
            }]
        },
        // 直角坐标系内绘图网格
        grid: {
            show: false, // 是否显示直角坐标系网格,外边框
            top: '30', // 离容器左侧的距离
            right: '10', // 离容器上侧的距离
            left: '10', // 离容器左侧的距离
            bottom: '0', // 离容器底部的距离
            borderColor: '#ff0', // 外边框颜色
            containLabel: true // 是否包含坐标轴的刻度标签,默认为false;true时防止标签溢出
        },
        // 提示框组件
        tooltip: {
            trigger: 'axis', // 触发类型,axis:坐标轴触发
            axisPointer: {
                // 坐标轴指示器配置项
                type: 'shadow', // 指示器类型:line、shadow、none、cross
                shadowStyle: {
                    color: 'rgba(216, 216, 216, 0.1)'
                }
            },
            backgroundColor: 'rgba(216, 216, 216, 0.1)', // 提示框浮层的背景颜色
            borderColor: 'rgba(216, 216, 216, 0.1)', // 提示框浮层的边框颜色
            textStyle: {
                color: '#B1DEFF',
                fontSize: '24',
                fontFamily:'PangMenZhengDao',
            },
            formatter: function (params:any) {
                // 2.回调函数,可return dom 自定义样式
                return (
                    params[0].name +(timeType=='year'?'年<br>':'<br>')  +
                    '<div style="display:flex;align-items: center;">' + params[0].seriesName +':<span style="color: #fff;margin-right:6px;">'+ params[0].value + '</span>' + '<span style="font-size:14px;color: #B1DEFF;">亿元</span></div>'
                )
            }
        },
        // 图表背景色
        backgroundColor: 'transparent',
        // x 轴设置
        xAxis: [
            {
                type: 'category',
                nameLocation: 'end', // X轴名称位置
                nameTextStyle: {
                // X轴名称样式
                color: '#fff',
                fontWeight: 'bold'
                },
                nameGap: 10, // X轴名称与轴线之间的距离
                nameRotate: 0, // 坐标轴名称旋转
                axisLabel: {
                    // X轴类目名称样式
                    // interval: 'auto',
                    verticalAlign: 'middle',
                    lineHeight: 16,
                    margin: 20,
                    color: '#fff',
                    fontSize: 12,
                    fontFamily:'PangMenZhengDao',
                    rotate: 0,
                },
                axisLine: {
                    // X轴轴线设置
                    show: true,
                    lineStyle: {
                        color: 'rgba(216, 216, 216, 0.5)',
                        width: 1
                    }
                },
                axisTick: {
                    // X轴刻度相关设置
                    show: false
                },
                splitLine: {
                    // 横向分隔线
                    show: false
                },
                axisPointer: {
                    type: "line",
                    lineStyle: {
                        color: "rgba(216, 216, 216, 0.1)",
                        type: "solid",
                        width: 37,
                    },
                },
                // 类目数据
                data: yearData
            }
        ],
        // y轴设置
        yAxis: [
            {
                min: 0, // 坐标轴刻度最小值
                axisLine: {
                    // y轴轴线设置
                    show: true,
                    lineStyle: {
                        color: 'rgba(216, 216, 216, 0.5)',
                        width: 1
                    }
                },
                axisLabel: {
                    // y轴刻度标签
                    formatter: '{value}',
                    inside: false, // 刻度标签是否朝内,默认朝外
                    textStyle: {
                        color: 'rgba(255, 255, 255, 1)',
                        fontSize: 12,
                        fontFamily:'PangMenZhengDao'
                    }
                },
                axisTick: {
                    // 刻度设置
                    show: false
                },
                splitLine: {
                    // 纵向分隔线
                    show: true,
                    lineStyle: {
                        color: 'rgba(216, 216, 216, 0.2)',
                        type: 'dashed'
                    }
                }
            }
        ],
        series: [
            {
                name: '地区生产总值',
                type: 'line',
                markPoint: 'arrow',
                lineStyle: {
                    color: 'rgba(0, 152, 250, 1)', // 线条颜色
                    shadowColor: 'rgba(0, 152, 250, 1)', // 设置阴影颜色
                    shadowBlur: 10 // 设置阴影的模糊大小
                },
                itemStyle: {
                    color: "rgba(30, 231, 231, 1)", //点的颜色
                    borderColor: "rgba(30, 231, 231, 0.4)",
                    borderWidth: 6,
                    shadowColor: "rgba(30, 231, 231, 0.2)",
                    shadowBlur: 0,
                    shadowOffsetY: 1,
                    shadowOffsetX: 1,
                },
                emphasis: {
                    itemStyle: {
                        // 鼠标经过时:
                        borderColor: "rgba(255, 255, 255, .4)",
                        shadowColor: "rgba(255, 255, 255, 0.2)",
                        color: "rgba(255, 255, 255, 1)",
                        borderWidth: 6,
                        shadowBlur: 0,
                        shadowOffsetY: 1,
                        shadowOffsetX: 1,
                    },
                },
                symbol: "circle", //将小圆点改成实心 不写symbol默认空心
                symbolSize: 8,
                areaStyle: {
                    normal: {
                        color: {
                            type: 'linear',
                            x: 0,
                            y: 0,
                            x2: 0,
                            y2: 1,
                            colorStops: [{
                                offset: 0,
                                color: 'rgba(0, 94, 255, 0.36)' // 0% 处的颜色
                            }, {
                                offset: 1,
                                color: 'rgba(0, 94, 255, 0.03)' // 100% 处的颜色
                            }],
                            globalCoord: false // 缺省为 false
                        }
                    }
                },
                data: areaData
            }
        ]
    }
    myChart.setOption(option);
    // 根据页面大小自动响应图表大小
    window.addEventListener("resize", function () {
        myChart.resize();
    });
    }
  onMounted(() => {
    getData() // 使用方法放在onMounted中
  });
  </script>
<style lang="scss" scoped>
.right-two-box {
    width: 1004px;
    height: 192px;
    margin: 0 auto;
    #right-echarts-two-id {
        width: 100%;
        height: 100%;
    }
}
</style>
以上就是Vue3使用echarts绘制特殊样式的折线图和柱状图的详细内容,更多关于Vue3 echarts绘制折线图和柱状图的资料请关注脚本之家其它相关文章!
相关文章
 这篇文章主要介绍了vue页面切换过渡transition效果,本文通过实例代码给大家介绍的非常详细,具有一定的参考借鉴价值,需要的朋友可以参考下2018-10-10
 这篇文章主要介绍了从vue源码看Vue.set()和this.$set()的相关知识,我们先来从Vue提供的Vue.set()和this.$set()这两个api看看它内部是怎么实现的。感兴趣的朋友跟随小编一起看看吧2018-08-08
 这篇文章主要介绍了vue实现的组件兄弟间通信功能,结合实例形式分析了vue兄弟组件间通信的原理与相关操作技巧,需要的朋友可以参考下2018-12-12
 这篇文章主要介绍了对Vue3中reactive的深入理解,具有很好的参考价值,希望对大家有所帮助。如有错误或未考虑完全的地方,望不吝赐教2022-05-05
 这篇文章主要给大家介绍了关于vue3如何监听页面的滚动的相关资料,在vue中实现滚动监听和原生js无太大差异,文中通过图文介绍的非常详细,需要的朋友可以参考下2023-07-07
vue代理请求之Request failed with status code 404问题及解决
这篇文章主要介绍了vue代理请求之Request failed with status code 404问题及解决方案,具有很好的参考价值,希望对大家有所帮助。如有错误或未考虑完全的地方,望不吝赐教2023-07-07 今天小编就为大家分享一篇解决vue的过渡动画无法正常实现问题,具有很好的参考价值,希望对大家有所帮助。一起跟随小编过来看看吧2019-10-10
 这篇文章主要介绍了vue.js数据响应式原理解析,文章围绕主题展开详细的内容介绍,具有一定的参考价值,需要的朋友可以参考一下2022-08-08
 这篇文章主要给大家介绍了关于vue添加自定义右键菜单的相关资料,文中通过示例代码介绍的非常详细,对大家的学习或者工作具有一定的参考学习价值,需要的朋友们下面随着小编来一起学习学习吧2020-12-12
 这篇文章主要介绍了vue+vux vux安装出现错误问题及解决方案,具有很好的参考价值,希望对大家有所帮助。如有错误或未考虑完全的地方,望不吝赐教2022-08-08


最新评论