
Python matplotlib画曲线例题解析
更新时间:2020年02月07日 14:05:49 作者:行易软件技术团队
这篇文章主要介绍了Python matplotlib画曲线例题解析,文中通过示例代码介绍的非常详细,对大家的学习或者工作具有一定的参考学习价值,需要的朋友可以参考下
这篇文章主要介绍了Python matplotlib画曲线例题解析,文中通过示例代码介绍的非常详细,对大家的学习或者工作具有一定的参考学习价值,需要的朋友可以参考下
初学者,练习以下片段:
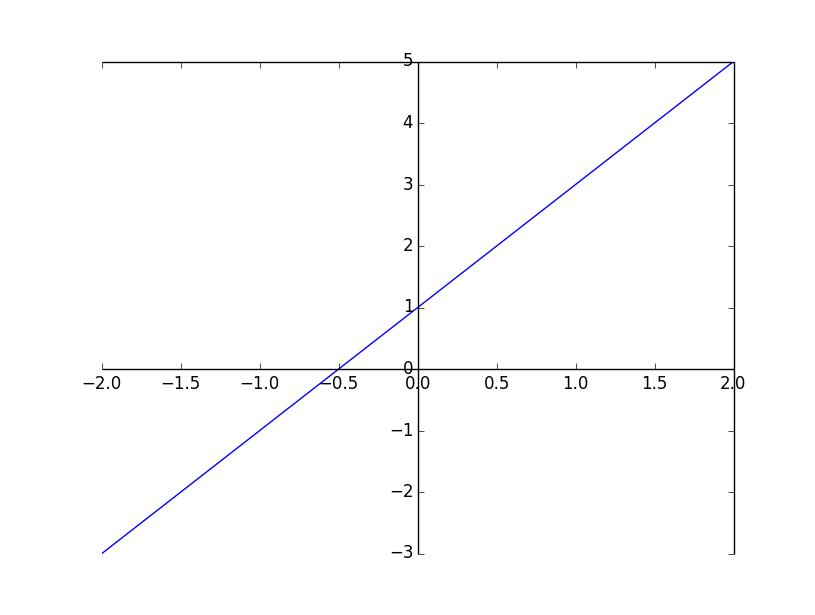
代码1:用 一元一次函数 画直线
import matplotlib.pyplot as plt
import numpy as np

x = np.linspace(-2, 2, 50)
print(x)
y = 2*x + 1
plt.plot(x, y)
ax = plt.gca()
ax.spines['bottom'].set_position(('data',0))
ax.spines['left'].set_position(('data',0))
plt.show()
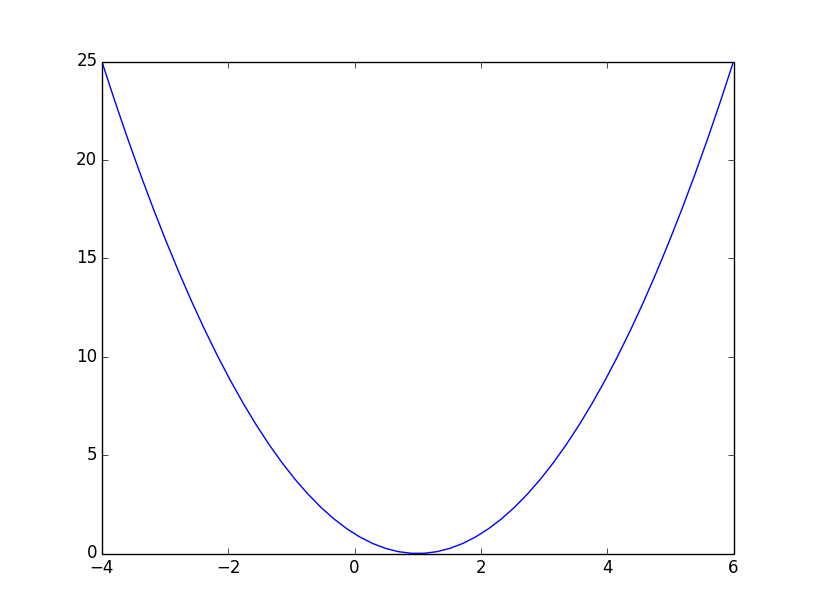
代码2:用 一元二次函数 画抛物线
import matplotlib.pyplot as plt
import numpy as np

x = np.linspace(-4, 6, 50)
print(type(x))
print(x)
y = x**2 - x*2+1
plt.plot(x, y)
plt.show()
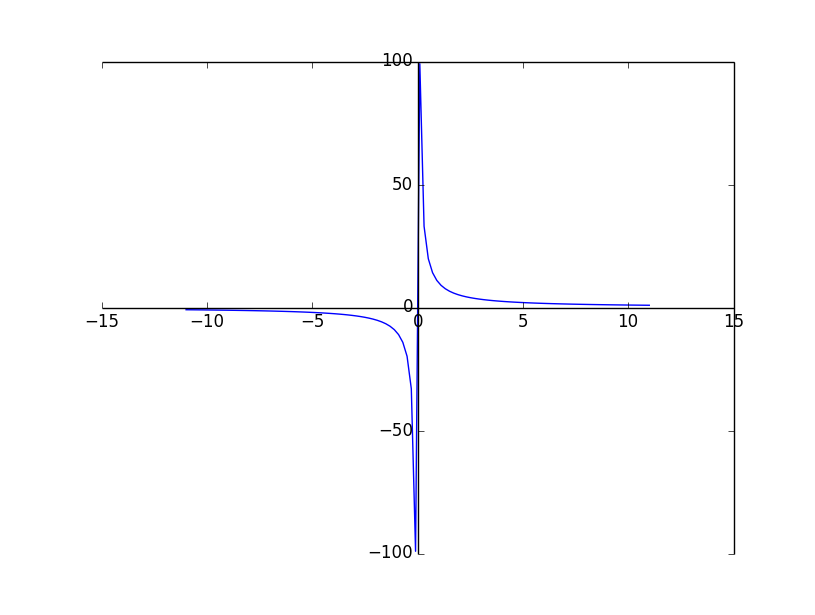
代码3:用反比例函数 画曲线
import matplotlib.pyplot as plt
import numpy as np

x = np.linspace(-11, 11, 110)
print(x)
y =10/x
plt.plot(x, y)
ax = plt.gca()
ax.spines['bottom'].set_position(('data',0))
ax.spines['left'].set_position(('data',0))
plt.show()
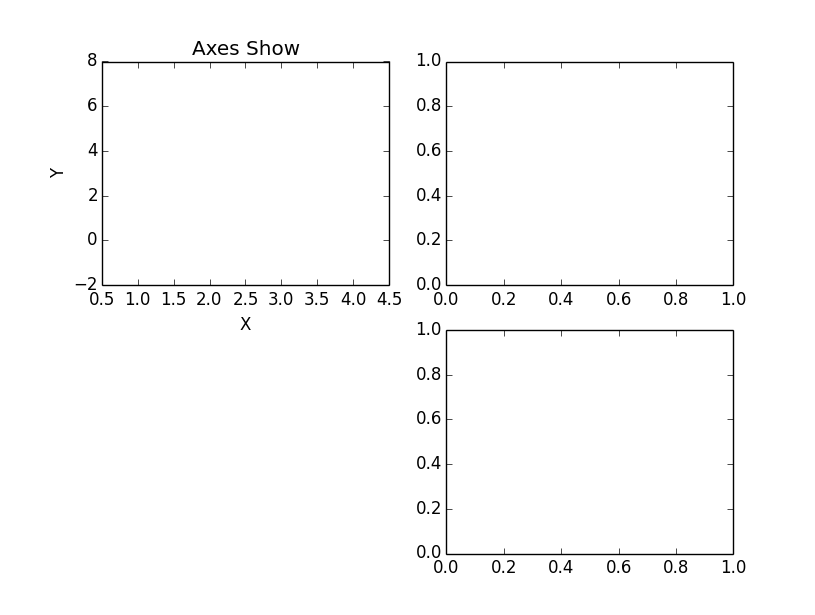
代码4:子坐标系的应用
import matplotlib.pyplot as plt
fig = plt.figure()
ax1 = fig.add_subplot(221)
ax2 = fig.add_subplot(222)
ax3 = fig.add_subplot(224)
ax1.set(xlim=[0.5, 4.5], ylim=[-2, 8], title='Axes Show',
    ylabel='Y', xlabel='X')
plt.show()
代码5:子坐标系的应用
import matplotlib.pyplot as plt
fig = plt.figure()
fig,axes=plt.subplots(nrows=2, ncols=2)
axes[0,0].set(xlim=[0.5, 4.5], ylim=[-2, 8], title='Axes Show',
    ylabel='Y', xlabel='X')
axes[0,1].set(title='Upper Right')
axes[1,0].set(title='Lower Left')
axes[1,1].set(title='Lower Right')
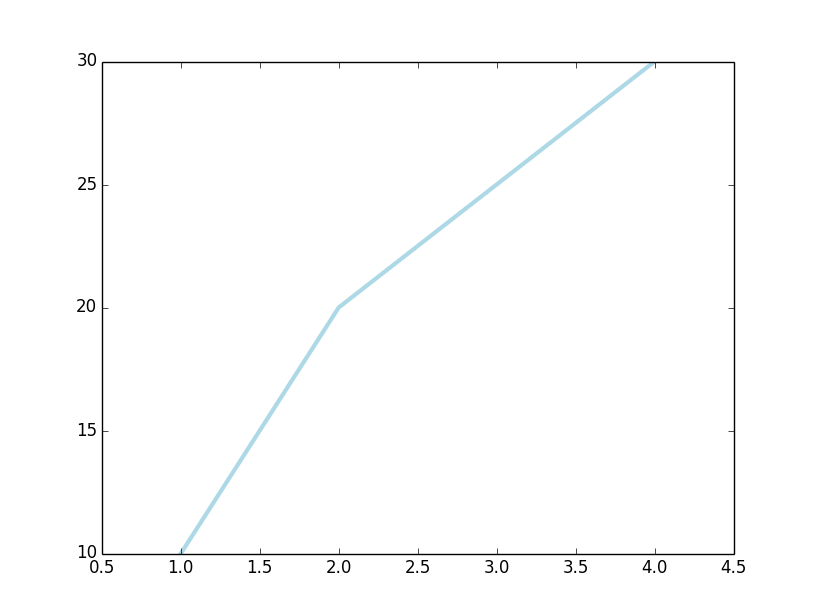
代码6:用已知少量坐标值画曲线
import matplotlib.pyplot as plt
plt.plot([1, 2, 3, 4], [10, 20, 25, 30], color='lightblue', linewidth=3)
plt.xlim(0.5, 4.5)
plt.show()
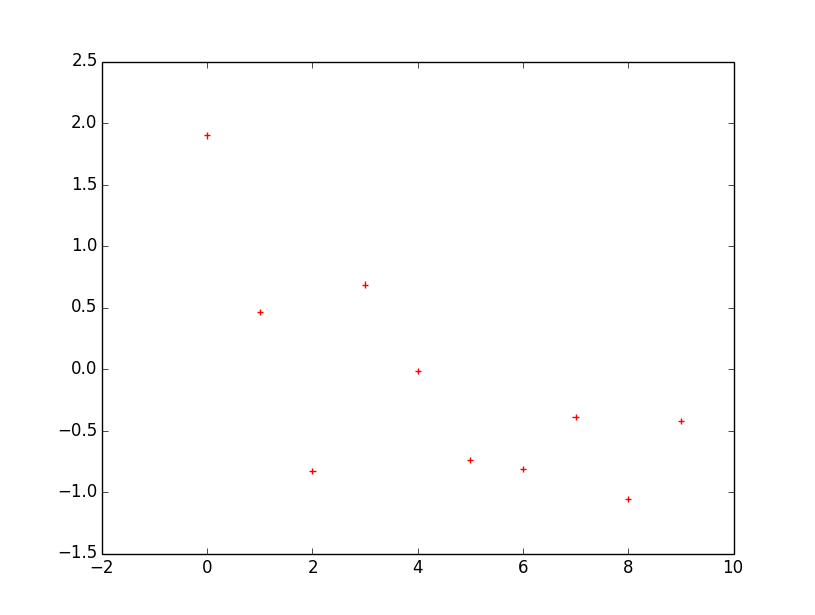
代码7:画离散点
mport matplotlib.pyplot as plt
import numpy as np
x = np.arange(10)
y = np.random.randn(10)
print(y)
plt.scatter(x, y, color='red', marker='+')
plt.show()
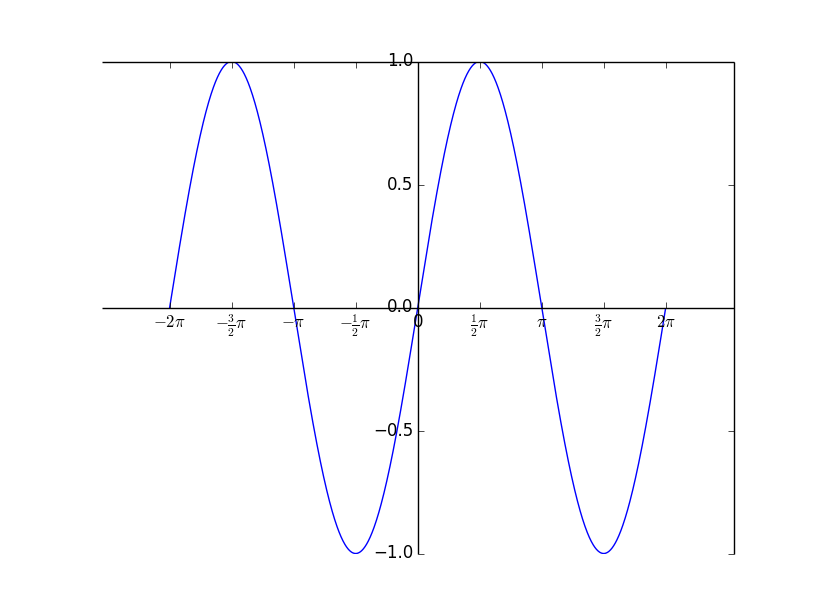
代码8:画出正弦曲线
import numpy as np
import matplotlib.pyplot as plt
x=np.arange(-2*np.pi,2*np.pi,0.01)
y=np.sin(x)
plt.plot(x,y)
ax = plt.gca()
ax.spines['bottom'].set_position(('data',0))
ax.spines['left'].set_position(('data',0))
plt.xticks([-np.pi*2,-np.pi*3/2,-np.pi, -np.pi/2, 0, np.pi/2, np.pi,np.pi*3/2,np.pi*2],[r'$-2\pi$',r'$-\frac{3}{2} \pi$',r'$-\pi$',r'$-\frac{1}{2}\pi$', r'0', r'$\frac{1}{2}\pi$','$\pi$',r'$\frac{3}{2}\pi$',r'$2 \pi$'])
plt.show()
以上就是本文的全部内容,希望对大家的学习有所帮助,也希望大家多多支持脚本之家。
您可能感兴趣的文章:
相关文章
 PyCharm是一款很流行的Python编辑器,经常遇到在PyCharm中把中文翻译成英文的需求,下面这篇文章主要给大家介绍了关于pycharm使用Translation插件实现翻译功能的相关资料,需要的朋友可以参考下2023-05-05
 今天小编就为大家分享一篇在pytorch中实现只让指定变量向后传播梯度,具有很好的参考价值,希望对大家有所帮助。一起跟随小编过来看看吧2020-02-02
Django中QuerySet查询优化之prefetch_related详解
prefetch_related()和select_related()的设计目的很相似,都是为了减少SQL查询的数量,但是实现的方式不一样,下面这篇文章主要给大家介绍了关于Django中QuerySet查询优化之prefetch_related的相关资料,需要的朋友可以参考下2022-11-11
python 内置函数-range()+zip()+sorted()+map()+reduce()+filte
这篇文章主要介绍了python 内置函数-range()+zip()+sorted()+map()+reduce()+filter(),想具体了解函数具体用法的小伙伴可以参考一下下面的介绍,希望对你有所帮助2021-12-12 这篇文章主要介绍了python神经网络编程之手写数字识别,文中有非常详细的代码示例,对正在学习python神经网络编程的小伙伴们有很好地帮助,需要的朋友可以参考下2021-05-05
 这篇文章主要介绍了Python matplotlib修改默认字体的操作,具有很好的参考价值,希望对大家有所帮助。一起跟随小编过来看看吧2020-03-03
Python如何利用Har文件进行遍历指定字典替换提交的数据详解
这篇文章主要给大家介绍了关于Python如何利用Har文件进行遍历指定字典替换提交的数据的相关资料,文中通过示例代码介绍的非常详细,对大家的学习或者工作具有一定的参考学习价值,需要的朋友们下面随着小编来一起学习学习吧2020-11-11 本文主要介绍了Python读写二进制文件的实现,文中通过示例代码介绍的非常详细,对大家的学习或者工作具有一定的参考学习价值,需要的朋友们下面随着小编来一起学习学习吧2023-04-04
 这篇文章主要为大家介绍了Python进程和守护进程,具有一定的参考价值,感兴趣的小伙伴们可以参考一下,希望能够给你带来帮助2021-12-12
 今天小编就为大家分享一篇PyQt5 在label显示的图片中绘制矩形的方法,具有很好的参考价值。希望对大家有所帮助。一起跟随小编过来看看吧2019-06-06


最新评论