
Python之Matplotlib文字与注释的使用方法
可视化对于大家来说确实是有关的,因为确实是直观的,每一组大数据如果可以用可视化进行展示的话可以让大家豁然开朗。但在另外一些场景中,辅之以少量的文字提示(textual cue)和标签是必不可少的。虽然最基本的注释(annotation)类型可能只是坐标轴标题与图标题,但注释可远远不止这些。让我们可视化一些数据,看看如何通过添加注释来更恰当地表达信息。
首先导入画图需要用到的一些函数:
import matplotlib.pyplot as plt
import matplotlib as mpl
plt.style.use('seaborn-whitegrid')
import numpy as np
import pandas as pd
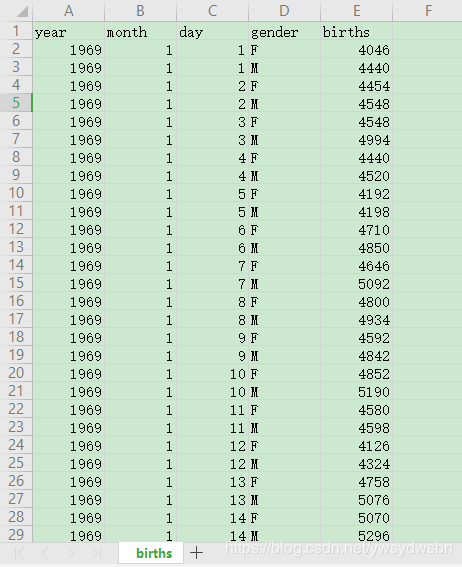
1 案例:节假日对美国出生率的影响
数据可以在 https://github.com/jakevdp/data-CDCbirths 下载,数据类型如下:
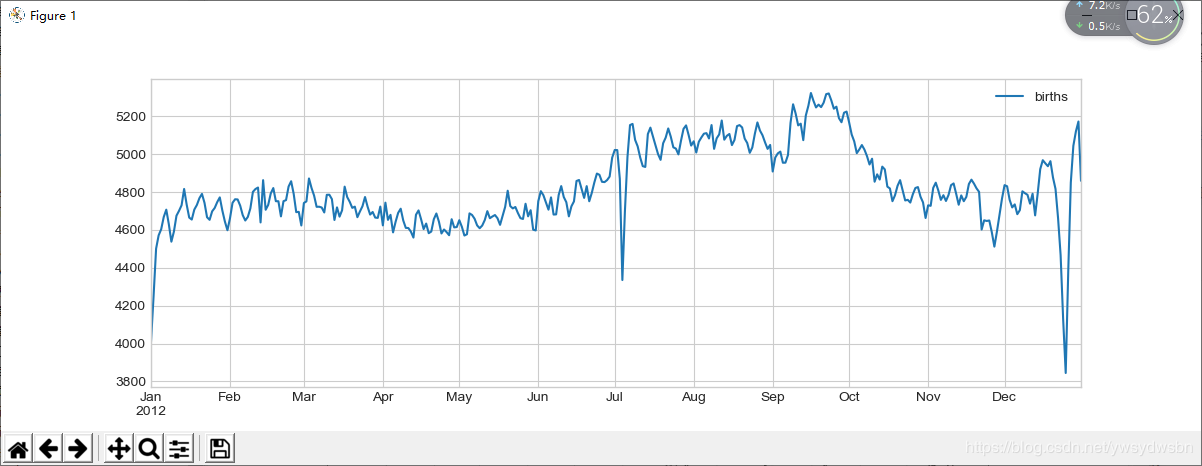
用清洗方法处理数据,然后画出结果。
日均出生人数统计图
births = pd.read_csv('births.csv')
quartiles = np.percentile(births['births'], [25, 50, 75])
mu, sig = quartiles[1], 0.74 * (quartiles[2] - quartiles[0])
births = births.query('(births > @mu - 5 * @sig) & (births < @mu + 5 * @sig)')
births['day'] = births['day'].astype(int)
births.index = pd.to_datetime(10000 * births.year + 100 * births.month + births.day, format='%Y%m%d')
births_by_date = births.pivot_table('births', [births.index.month, births.index.day])
births_by_date.index = [pd.datetime(2012, month, day) for (month, day) in births_by_date.index]
fig, ax = plt.subplots(figsize=(12, 4))
births_by_date.plot(ax=ax);
import matplotlib.pyplot as plt
import matplotlib as mpl
plt.style.use('seaborn-whitegrid')
import numpy as np
import pandas as pd
births = pd.read_csv('C:\\Users\\Y\\Desktop\\data-CDCbirths-master\\births.csv')
quartiles = np.percentile(births['births'], [25, 50, 75])
mu, sig = quartiles[1], 0.74 * (quartiles[2] - quartiles[0])
births = births.query('(births > @mu - 5 * @sig) & (births < @mu + 5 * @sig)')
births['day'] = births['day'].astype(int)
births.index = pd.to_datetime(10000 * births.year + 100 * births.month + births.day, format='%Y%m%d')
births_by_date = births.pivot_table('births', [births.index.month, births.index.day])
births_by_date.index = [pd.datetime(2012, month, day) for (month, day) in births_by_date.index]
fig, ax = plt.subplots(figsize=(12, 4))
births_by_date.plot(ax=ax);
plt.show()
为日均出生人数统计图添加注释
在用这样的图表达观点时,如果可以在图中增加一些注释,就更能吸引读者的注意了。可以通过 plt.text / ax.text 命令手动添加注释,它们可以在具体的 x / y 坐标点上放上文字
fig, ax = plt.subplots(figsize=(12, 4))
births_by_date.plot(ax=ax)
# 在图上增加文字标签
style = dict(size=10, color='gray')
ax.text('2012-1-1', 3950, "New Year's Day", **style)
ax.text('2012-7-4', 4250, "Independence Day", ha='center', **style)
ax.text('2012-9-4', 4850, "Labor Day", ha='center', **style)
ax.text('2012-10-31', 4600, "Halloween", ha='right', **style)
ax.text('2012-11-25', 4450, "Thanksgiving", ha='center', **style)
ax.text('2012-12-25', 3850, "Christmas ", ha='right', **style)
# 设置坐标轴标题
ax.set(title='USA births by day of year (1969-1988)',
ylabel='average daily births')
# 设置x轴刻度值,让月份居中显示
ax.xaxis.set_major_locator(mpl.dates.MonthLocator())
ax.xaxis.set_minor_locator(mpl.dates.MonthLocator(bymonthday=15))
ax.xaxis.set_major_formatter(plt.NullFormatter())
ax.xaxis.set_minor_formatter(mpl.dates.DateFormatter('%h'));
import matplotlib.pyplot as plt
import matplotlib as mpl
plt.style.use('seaborn-whitegrid')
import numpy as np
import pandas as pd
births = pd.read_csv('C:\\Users\\Y\\Desktop\\data-CDCbirths-master\\births.csv')
quartiles = np.percentile(births['births'], [25, 50, 75])
mu, sig = quartiles[1], 0.74 * (quartiles[2] - quartiles[0])
births = births.query('(births > @mu - 5 * @sig) & (births < @mu + 5 * @sig)')
births['day'] = births['day'].astype(int)
births.index = pd.to_datetime(10000 * births.year + 100 * births.month + births.day, format='%Y%m%d')
births_by_date = births.pivot_table('births', [births.index.month, births.index.day])
births_by_date.index = [pd.datetime(2012, month, day) for (month, day) in births_by_date.index]
fig, ax = plt.subplots(figsize=(12, 4))
births_by_date.plot(ax=ax)
# 在图上增加文字标签
style = dict(size=10, color='gray')
ax.text('2012-1-1', 3950, "New Year's Day", **style)
ax.text('2012-7-4', 4250, "Independence Day", ha='center', **style)
ax.text('2012-9-4', 4850, "Labor Day", ha='center', **style)
ax.text('2012-10-31', 4600, "Halloween", ha='right', **style)
ax.text('2012-11-25', 4450, "Thanksgiving", ha='center', **style)
ax.text('2012-12-25', 3850, "Christmas ", ha='right', **style)
# 设置坐标轴标题
ax.set(title='USA births by day of year (1969-1988)',
ylabel='average daily births')
# 设置x轴刻度值,让月份居中显示
ax.xaxis.set_major_locator(mpl.dates.MonthLocator())
ax.xaxis.set_minor_locator(mpl.dates.MonthLocator(bymonthday=15))
ax.xaxis.set_major_formatter(plt.NullFormatter())
ax.xaxis.set_minor_formatter(mpl.dates.DateFormatter('%h'));
plt.show()
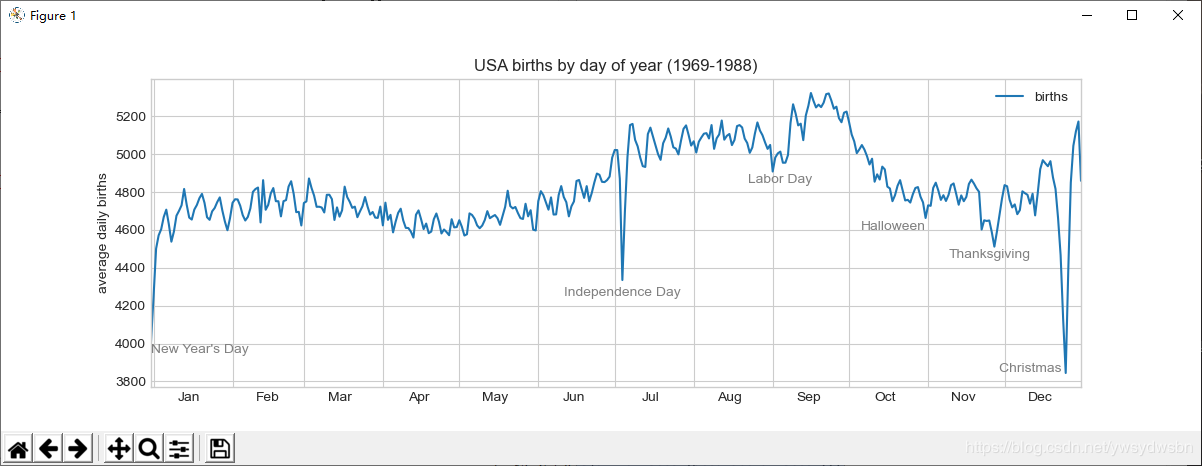
ax.text 方法需要一个 x 轴坐标、一个 y 轴坐标、一个字符串和一些可选参数,比如文字的颜色、字号、风格、对齐方式以及其他文字属性。这里用了 ha='right' 与 ha='center' ,ha 是水平对齐方式(horizonal alignment)的缩写。关于配置参数的更多信息,请参考plt.text() 与 mpl.text.Text() 的程序文档。
2 坐标变换与文字位置
前面的示例将文字放在了目标数据的位置上。但有时候可能需要将文字放在与数据无关的位置上,比如坐标轴或者图形中。在 Matplotlib 中,我们通过调整坐标变换(transform)来实现。
任何图形显示框架都需要一些变换坐标系的机制。例如,当一个位于 (x, y) = (1, 1) 位置的点需要以某种方式显示在图上特定的位置时,就需要用屏幕的像素来表示。用数学方法处理这种坐标系变换很简单,Matplotlib 有一组非常棒的工具可以实现类似功能(这些工具位于 matplotlib.transforms 子模块中)。
虽然一般用户并不需要关心这些变换的细节,但是了解这些知识对在图上放置文字大有帮助。一共有三种解决这类问题的预定义变换方式。
- ax.transData 以数据为基准的坐标变换。
- ax.transAxes 以坐标轴为基准的坐标变换(以坐标轴维度为单位)。
- fig.transFigure 以图形为基准的坐标变换(以图形维度为单位)。
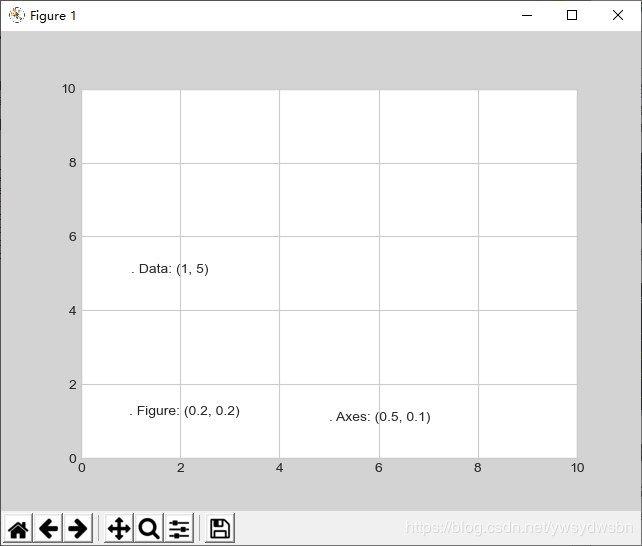
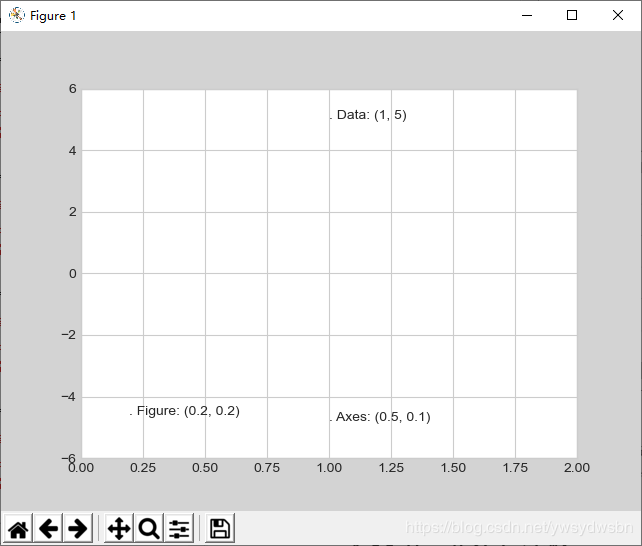
默认情况下,上面的文字在各自的坐标系中都是左对齐的。这三个字符串开头的 . 字符基本就是对应的坐标位置。
transData 坐标用 x 轴与 y 轴的标签作为数据坐标。
transAxes 坐标以坐标轴(图中白色矩形)左下角的位置为原点,按坐标轴尺寸的比例呈现坐标。
transFigure 坐标与之类似,不过是以图形(图中灰色矩形)左下角的位置为原点,按图形尺寸的比例呈现坐标。
对比 Matplotlib 的三种坐标系(1)
下面举一个例子,用三种变换方式将文字画在不同的位置:
fig, ax = plt.subplots(facecolor='lightgray')
ax.axis([0, 10, 0, 10])
# 虽然transform=ax.transData是默认值,但还是设置一下
ax.text(1, 5, ". Data: (1, 5)", transform=ax.transData)
ax.text(0.5, 0.1, ". Axes: (0.5, 0.1)", transform=ax.transAxes)
ax.text(0.2, 0.2, ". Figure: (0.2, 0.2)", transform=fig.transFigure);
import matplotlib.pyplot as plt
import matplotlib as mpl
plt.style.use('seaborn-whitegrid')
import numpy as np
import pandas as pd
births = pd.read_csv('C:\\Users\\Y\\Desktop\\data-CDCbirths-master\\births.csv')
quartiles = np.percentile(births['births'], [25, 50, 75])
mu, sig = quartiles[1], 0.74 * (quartiles[2] - quartiles[0])
births = births.query('(births > @mu - 5 * @sig) & (births < @mu + 5 * @sig)')
births['day'] = births['day'].astype(int)
births.index = pd.to_datetime(10000 * births.year + 100 * births.month + births.day, format='%Y%m%d')
births_by_date = births.pivot_table('births', [births.index.month, births.index.day])
births_by_date.index = [pd.datetime(2012, month, day) for (month, day) in births_by_date.index]
fig, ax = plt.subplots(facecolor='lightgray')
ax.axis([0, 10, 0, 10])
# 虽然transform=ax.transData是默认值,但还是设置一下
ax.text(1, 5, ". Data: (1, 5)", transform=ax.transData)
ax.text(0.5, 0.1, ". Axes: (0.5, 0.1)", transform=ax.transAxes)
ax.text(0.2, 0.2, ". Figure: (0.2, 0.2)", transform=fig.transFigure);
plt.show()
对比 Matplotlib 的三种坐标系(2)
需要注意的是,假如你改变了坐标轴上下限,那么只有 transData 坐标会受影响,其他坐标系都不变
ax.set_xlim(0, 2)
ax.set_ylim(-6, 6)
fig
import matplotlib.pyplot as plt
import matplotlib as mpl
plt.style.use('seaborn-whitegrid')
import numpy as np
import pandas as pd
births = pd.read_csv('C:\\Users\\Y\\Desktop\\data-CDCbirths-master\\births.csv')
quartiles = np.percentile(births['births'], [25, 50, 75])
mu, sig = quartiles[1], 0.74 * (quartiles[2] - quartiles[0])
births = births.query('(births > @mu - 5 * @sig) & (births < @mu + 5 * @sig)')
births['day'] = births['day'].astype(int)
births.index = pd.to_datetime(10000 * births.year + 100 * births.month + births.day, format='%Y%m%d')
births_by_date = births.pivot_table('births', [births.index.month, births.index.day])
births_by_date.index = [pd.datetime(2012, month, day) for (month, day) in births_by_date.index]
fig, ax = plt.subplots(facecolor='lightgray')
ax.axis([0, 10, 0, 10])
# 虽然transform=ax.transData是默认值,但还是设置一下
ax.text(1, 5, ". Data: (1, 5)", transform=ax.transData)
ax.text(0.5, 0.1, ". Axes: (0.5, 0.1)", transform=ax.transAxes)
ax.text(0.2, 0.2, ". Figure: (0.2, 0.2)", transform=fig.transFigure);
ax.set_xlim(0, 2)
ax.set_ylim(-6, 6)
fig
plt.show()
如果你改变了坐标轴上下限,那么就可以更清晰地看到刚刚所说的变化。
3 箭头与注释
除了刻度线和文字,简单的箭头也是一种有用的注释标签。
在 Matplotlib 里面画箭头通常比你想象的要困难。虽然有一个 plt.arrow() 函数可以实现这个功能,但是我不推荐使用它,因为它创建出的箭头是 SVG 向量图对象,会随着图形分辨率的变化而改变,最终的结果可能完全不是用户想要的。我要推荐的是 plt.annotate()函数。这个函数既可以创建文字,也可以创建箭头,而且它创建的箭头能够进行非常灵活的配置。
图形注释
下面用 annotate 的一些配置选项来演示
fig, ax = plt.subplots()
x = np.linspace(0, 20, 1000)
ax.plot(x, np.cos(x))
ax.axis('equal')
ax.annotate('local maximum', xy=(6.28, 1), xytext=(10, 4),arrowprops=dict(facecolor='black', shrink=0.05))
ax.annotate('local minimum', xy=(5 * np.pi, -1), xytext=(2, -6),arrowprops=dict(arrowstyle="->",
connectionstyle="angle3,angleA=0,angleB=-90"));
import matplotlib.pyplot as plt
import matplotlib as mpl
plt.style.use('seaborn-whitegrid')
import numpy as np
import pandas as pd
births = pd.read_csv('C:\\Users\\Y\\Desktop\\data-CDCbirths-master\\births.csv')
quartiles = np.percentile(births['births'], [25, 50, 75])
mu, sig = quartiles[1], 0.74 * (quartiles[2] - quartiles[0])
births = births.query('(births > @mu - 5 * @sig) & (births < @mu + 5 * @sig)')
births['day'] = births['day'].astype(int)
births.index = pd.to_datetime(10000 * births.year + 100 * births.month + births.day, format='%Y%m%d')
births_by_date = births.pivot_table('births', [births.index.month, births.index.day])
births_by_date.index = [pd.datetime(2012, month, day) for (month, day) in births_by_date.index]

fig, ax = plt.subplots()
x = np.linspace(0, 20, 1000)
ax.plot(x, np.cos(x))
ax.axis('equal')
ax.annotate('local maximum', xy=(6.28, 1), xytext=(10, 4),arrowprops=dict(facecolor='black', shrink=0.05))
ax.annotate('local minimum', xy=(5 * np.pi, -1), xytext=(2, -6),arrowprops=dict(arrowstyle="->",connectionstyle="angle3,angleA=0,angleB=-90"));

plt.show()
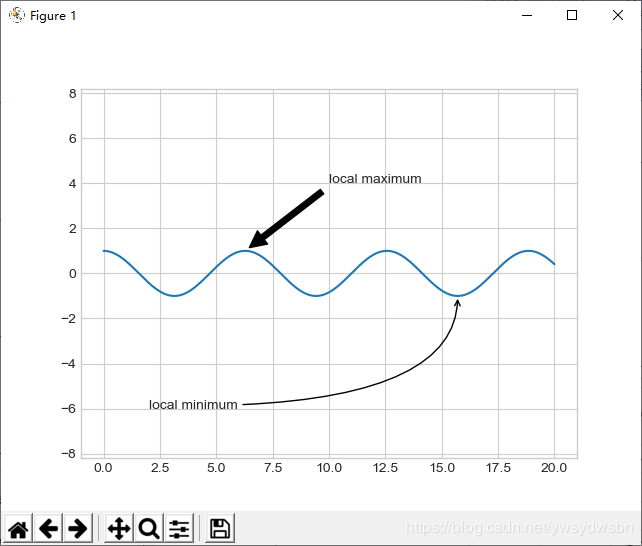
箭头的风格是通过 arrowprops 字典控制的,里面有许多可用的选项。由于这些选项在Matplotlib 的官方文档中都有非常详细的介绍,我就不再赘述,仅做一点儿功能演示。
带注释的日均出生人数
让我们用前面的美国出生人数图来演示一些箭头注释
fig, ax = plt.subplots(figsize=(12, 4))
births_by_date.plot(ax=ax)
# 在图上增加箭头标签
ax.annotate("New Year's Day", xy=('2012-1-1', 4100), xycoords='data',xytext=(50, -30), textcoords='offset points',arrowprops=dict(arrowstyle="->",connectionstyle="arc3,rad=-0.2"))
ax.annotate("Independence Day", xy=('2012-7-4', 4250),xycoords='data',bbox=dict(boxstyle="round", fc="none", ec="gray"),xytext=(10, -40), textcoords='offset points', ha='center', arrowprops=dict(arrowstyle="->"))
ax.annotate('Labor Day', xy=('2012-9-4', 4850), xycoords='data', ha='center', xytext=(0, -20), textcoords='offset points')
ax.annotate('', xy=('2012-9-1', 4850), xytext=('2012-9-7', 4850), xycoords='data', textcoords='data', arrowprops={'arrowstyle': '|-|,widthA=0.2,widthB=0.2', })
ax.annotate('Halloween', xy=('2012-10-31', 4600), xycoords='data', xytext=(-80, -40), textcoords='offset points', arrowprops=dict(arrowstyle="fancy", fc="0.6", ec="none", connectionstyle="angle3,angleA=0,angleB=-90"))
ax.annotate('Thanksgiving', xy=('2012-11-25', 4500), xycoords='data', xytext=(-120, -60), textcoords='offset points', bbox=dict(boxstyle="round4,pad=.5", fc="0.9"), arrowprops=dict(arrowstyle="->", connectionstyle="angle,angleA=0,angleB=80,rad=20"))
ax.annotate('Christmas', xy=('2012-12-25', 3850), xycoords='data', xytext=(-30, 0), textcoords='offset points', size=13, ha='right', va="center", bbox=dict(boxstyle="round", alpha=0.1), arrowprops=dict(arrowstyle="wedge,tail_width=0.5", alpha=0.1));
# 设置坐标轴标题
ax.set(title='USA births by day of year (1969-1988)', ylabel='average daily births')
# 设置x轴刻度值,让月份居中显示
ax.xaxis.set_major_locator(mpl.dates.MonthLocator())
ax.xaxis.set_minor_locator(mpl.dates.MonthLocator(bymonthday=15))
ax.xaxis.set_major_formatter(plt.NullFormatter())
ax.xaxis.set_minor_formatter(mpl.dates.DateFormatter('%h'));
ax.set_ylim(3600, 5400);
import matplotlib.pyplot as plt
import matplotlib as mpl
plt.style.use('seaborn-whitegrid')
import numpy as np
import pandas as pd
births = pd.read_csv('C:\\Users\\Y\\Desktop\\data-CDCbirths-master\\births.csv')
quartiles = np.percentile(births['births'], [25, 50, 75])
mu, sig = quartiles[1], 0.74 * (quartiles[2] - quartiles[0])
births = births.query('(births > @mu - 5 * @sig) & (births < @mu + 5 * @sig)')
births['day'] = births['day'].astype(int)
births.index = pd.to_datetime(10000 * births.year + 100 * births.month + births.day, format='%Y%m%d')
births_by_date = births.pivot_table('births', [births.index.month, births.index.day])
births_by_date.index = [pd.datetime(2012, month, day) for (month, day) in births_by_date.index]

fig, ax = plt.subplots(figsize=(12, 4))
births_by_date.plot(ax=ax)
# 在图上增加箭头标签
ax.annotate("New Year's Day", xy=('2012-1-1', 4100), xycoords='data',
			xytext=(50, -30), textcoords='offset points',
			arrowprops=dict(arrowstyle="->",
			connectionstyle="arc3,rad=-0.2"))
ax.annotate("Independence Day", xy=('2012-7-4', 4250), 	xycoords='data',
			bbox=dict(boxstyle="round", fc="none", ec="gray"),
			xytext=(10, -40), textcoords='offset points', ha='center',
			arrowprops=dict(arrowstyle="->"))
ax.annotate('Labor Day', xy=('2012-9-4', 4850), xycoords='data', 		ha='center',
			xytext=(0, -20), textcoords='offset points')
			ax.annotate('', xy=('2012-9-1', 4850), xytext=('2012-9-7', 4850),
			xycoords='data', textcoords='data',
			arrowprops={'arrowstyle': '|-|,widthA=0.2,widthB=0.2', })
ax.annotate('Halloween', xy=('2012-10-31', 4600), xycoords='data',
			xytext=(-80, -40), textcoords='offset points',
			arrowprops=dict(arrowstyle="fancy",
			fc="0.6", ec="none",
			connectionstyle="angle3,angleA=0,angleB=-90"))
ax.annotate('Thanksgiving', xy=('2012-11-25', 4500), xycoords='data',
			xytext=(-120, -60), textcoords='offset points',
			bbox=dict(boxstyle="round4,pad=.5", fc="0.9"),
			arrowprops=dict(arrowstyle="->",
			connectionstyle="angle,angleA=0,angleB=80,rad=20"))
ax.annotate('Christmas', xy=('2012-12-25', 3850), xycoords='data',xytext=(-30, 0), textcoords='offset points',size=13, 		ha='right', va="center",bbox=dict(boxstyle="round", 		alpha=0.1),arrowprops=dict(arrowstyle="wedge,tail_width=0.5", 	alpha=0.1));
# 设置坐标轴标题
ax.set(title='USA births by day of year (1969-1988)',ylabel='average daily births')
# 设置x轴刻度值,让月份居中显示
ax.xaxis.set_major_locator(mpl.dates.MonthLocator())
ax.xaxis.set_minor_locator(mpl.dates.MonthLocator(bymonthday=15))
ax.xaxis.set_major_formatter(plt.NullFormatter())
ax.xaxis.set_minor_formatter(mpl.dates.DateFormatter('%h'));
ax.set_ylim(3600, 5400);

plt.show()
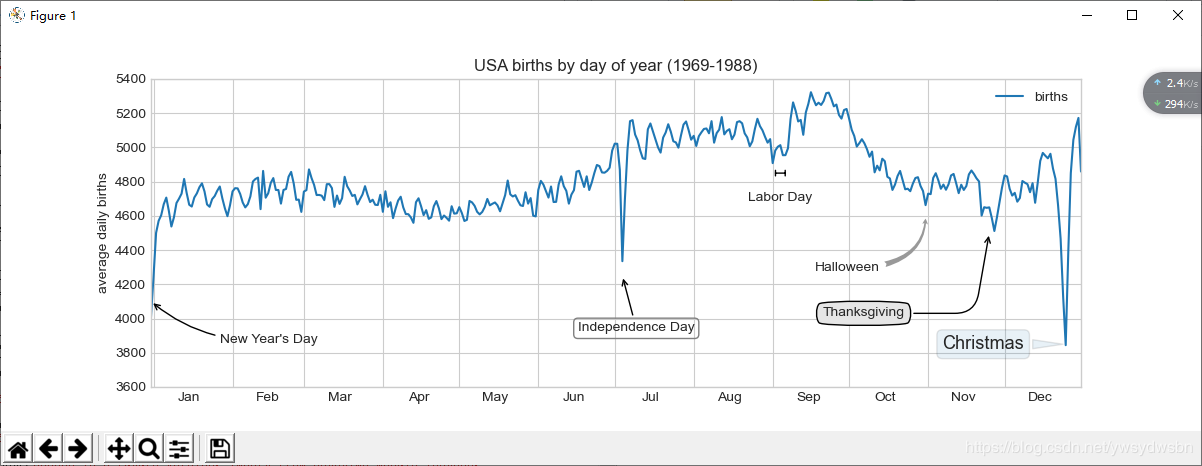
你可能已经注意到了,箭头和文本框的配置功能非常细致,这样你就可以创建自己想要的箭头风格了。不过,功能太过细致往往也就意味着操作起来比较复杂,如果真要做一个产品级的图形,可能得耗费大量的时间。最后我想说一句,前面适用的混合风格并不是数据可视化的最佳实践,仅仅是为演示一些功能而已。
到此这篇关于Python之Matplotlib文字与注释的使用方法的文章就介绍到这了,更多相关Matplotlib文字与注释内容请搜索脚本之家以前的文章或继续浏览下面的相关文章希望大家以后多多支持脚本之家!
相关文章
 今天小编就为大家分享一篇解决python中的幂函数、指数函数问题,具有很好的参考价值,希望对大家有所帮助。一起跟随小编过来看看吧2019-11-11
 RxPy是非常流行的响应式框架Reactive X的Python版本,其实这些版本都是一样的,只不过是各个语言的实现不同而已。因此,如果学会了其中一种,那么使用其他的响应式版本也是轻而易举的2021-06-06
Queue队列中join()与task_done()的关系及说明
这篇文章主要介绍了Queue队列中join()与task_done()的关系及说明,具有很好的参考价值,希望对大家有所帮助。如有错误或未考虑完全的地方,望不吝赐教2023-02-02 这篇文章主要介绍了Python 爬虫实现增加播客访问量的方法实现,文中通过示例代码介绍的非常详细,对大家的学习或者工作具有一定的参考学习价值,需要的朋友们下面随着小编来一起学习学习吧2019-10-10
 Scrapy爬虫框架可以实现多线程爬取目标内容,简化代码逻辑,提高开发效率,这篇文章主要介绍了Python Scrapy爬虫框架的使用示例,感兴趣想要详细了解可以参考下文2023-05-05
 这篇文章主要介绍了如何利用Python制作一个多进制转换工具,可以实现2进制、4进制、8进制、10进制、16进制、32进制直接的互转,需要的可以参考一下2022-02-02
 这篇文章主要为大家详细介绍了Python如何实现本地分页的算法,主要针对二级数据结构,文中的示例代码简洁易懂,有需要的小伙伴可以了解下2025-02-02
python pip特殊用法之pip install -v -e .命令详解
这篇文章主要给大家介绍了关于python pip特殊用法之pip install -v -e .命令的相关资料,文中通过图文以及实例代码介绍的非常详细,对大家的学习或者工作具有一定的参考学习价值,需要的朋友可以参考下2022-09-09 descriptor在Python中主要被用来定义方法和属性,使用起来相当具有技巧性,这里我们先从基础的开始,整理一份Python中的descriptor描述器简明使用指南2016-06-06
 文章介绍了Python中列表的增删改操作,包括如何使用`append()`、`extend()`、`insert()`方法增加元素,使用`del`、`remove()`、`pop()`方法删除元素,以及通过索引修改元素,感兴趣的朋友一起看看吧2025-02-02


最新评论