
用Python实现流星雨效果的方法详解
更新时间:2021年12月20日 15:08:24 作者:微小冷
这篇文章主要为大家介绍了Python实现流星雨效果的方法,具有一定的参考价值,感兴趣的小伙伴们可以参考一下,希望能够给你带来帮助<BR>
流星雨的前提是得先有一个流星,所谓流星,就是一个拖着尾巴的直线。所谓拖着尾巴,实际上是我们的浪漫想象,实质无非是尺寸和颜色的渐变罢了。
而matplotlib并不能给一条曲线映射多个颜色,故而可将一条线拆分成多条,效果如图所示
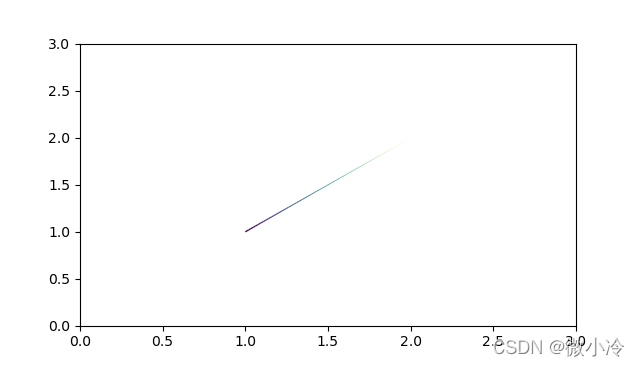
代码为
import numpy as np
import matplotlib.pyplot as plt
from matplotlib.collections import LineCollection

x0,y0 = 1,1     #此为流星位置
ts = np.arange(0,1,0.01)    #参数
xs,ys = x0+ts, y0+ts        #绘图线条

points = np.array([xs, ys]).T.reshape(-1, 1, 2)
segments = np.concatenate([points[:-1], points[1:]], axis=1)

ax = plt.subplot()
lc = LineCollection(segments, cmap='viridis')

lc.set_array(ts)
lc.set_linewidth(ts[::-1])
line = ax.add_collection(lc)

ax.set_xlim(0, 3)
ax.set_ylim(0, 3)
plt.show()
接下来就要把这个流星变成流星雨,很简单,多加一些流星就可以了,效果如下,尽管是在白天,但是不是感觉有点意思了。

代码为
from numpy.random import rand, randint
N,L = 20,100  #流星个数和线段数
ts = np.array([
    np.linspace(0,rand(),L) for _ in range(N)]).T
x0,y0 = rand(2*N).reshape(2,1,N)
x0 *= 5
xs,ys = x0+ts, y0+ts #绘图线条1

points = np.array([xs, ys]).T.reshape(N,L,-1,2)

ax = plt.subplot()
for i in range(N):
    segs = np.concatenate([points[i][:-1], points[i][1:]], axis=1)
    lc = LineCollection(segs, cmap='viridis')
    lc.set_array(ts[:,i])
    lc.set_linewidth(ts[::-1,i])
    ax.add_collection(lc)

ax.set_xlim(0, 6)
ax.set_ylim(-2, 3)
ax.set_axis_off()                      #取消坐标轴
plt.show()
如果想让天黑下去,方法为
plt.figure(facecolor="black") #将背景设为黑色
此外,背景设为黑色之后,注意要把颜色映射调整一下,想知道更多具体的颜色映射表戳这里:matplotlib中的伪彩映射
lc = LineCollection(segs, cmap='viridis_r')
所以就是这种

总结
本篇文章就到这里了,希望能够给你带来帮助,也希望您能够多多关注脚本之家的更多内容!
相关文章
 这篇文章主要介绍了再Python程序中操作MySQL的基本方法,主要借助了MYSQLdb module,需要的朋友可以参考下2015-07-07
 函数是具有某种特定功能的代码块,可以重复使用。这篇文章将为大家详细介绍Python中函数的定义与使用,感兴趣的小伙伴可以学习一下2022-06-06
python manage.py createsuperuser运行错误问题解决
这篇文章主要介绍了python manage.py createsuperuser运行错误,本文给大家分享错误复现及解决方案,感兴趣的朋友一起看看吧2023-10-10 这篇文章主要为大家详细介绍了python实现聚类算法原理,具有一定的参考价值,感兴趣的小伙伴们可以参考一下2018-02-02
可用于监控 mysql Master Slave 状态的python代码
用于监控MySQL Master Slave 状态的python代码,有需要的朋友可以参考下2013-02-02 本文主要介绍了Python中typing模块的具体使用,文中通过示例代码介绍的非常详细,对大家的学习或者工作具有一定的参考学习价值,需要的朋友们下面随着小编来一起学习学习吧2022-05-05
 进程是一个具有一定独立功能的程序关于某个数据集合的一次运行活动。它是操作系统动态执行的基本单元,在传统的操作系统中,进程既是基本的分配单元,也是基本的执行单元。本文将介绍python实现网络进程2021-06-06
 这篇文章主要介绍了Python读取文件内容为字符串的方法,本文通过三种方式给大家介绍,在文章末尾给大家提到了python读取txt文件中字符串,字符串用空格分隔的相关知识,需要的朋友可以参考下2020-03-03
 在本篇文章里小编给网友们分享一篇关于关于Python错误重试方法总结内容,有需要的朋友们跟着学习参考下。2021-01-01
 这篇文章主要介绍了python 可视化库PyG2Plot的使用方法,帮助大家更好的理解和使用python,感兴趣的朋友可以了解下2021-01-01


最新评论