
python matplotlib各种画图
更新时间:2021年12月26日 10:16:13 作者:L-M-Y
这篇文章主要介绍了python matplotlib各种画图,matplotlib是一种优秀的python数据可视化第三方库,使用matpltlib库画图时,先将它引入,加载里面的pyplot,并命名为plt,然后使用plot函数画图<BR>,下面一起来了解更详细内容吧
1.引入matpltlib库
matplotlib是一种优秀的python数据可视化第三方库
使用matpltlib库画图时,先将它引入,加载里面的pyplot,并命名为plt,然后使用plot函数画图
import matplotlib.pyplot as plt #plt是引入模块的别名
2.pyplot基础图标函数总结

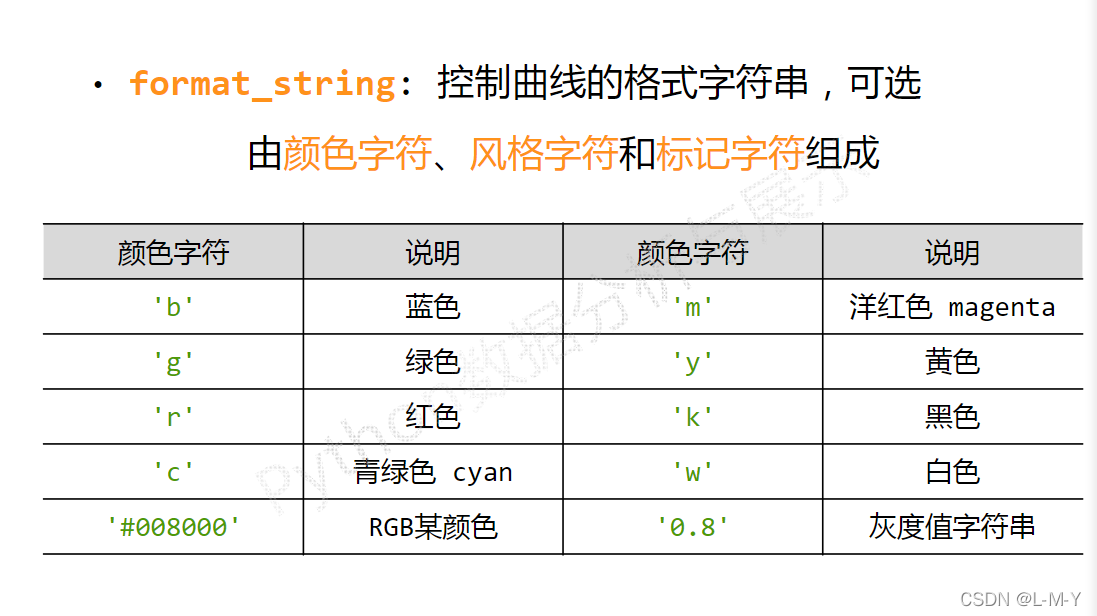
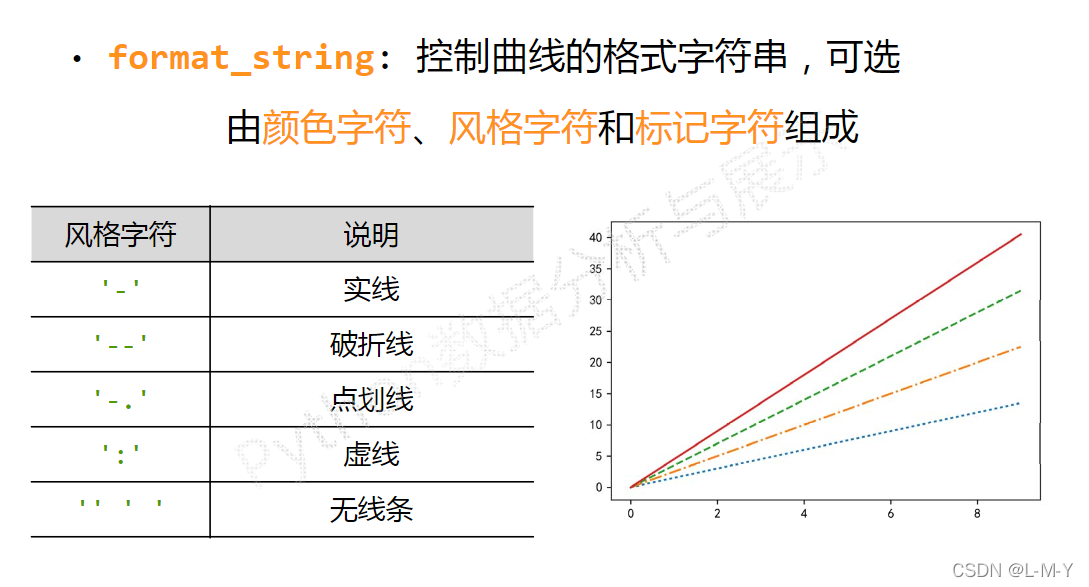
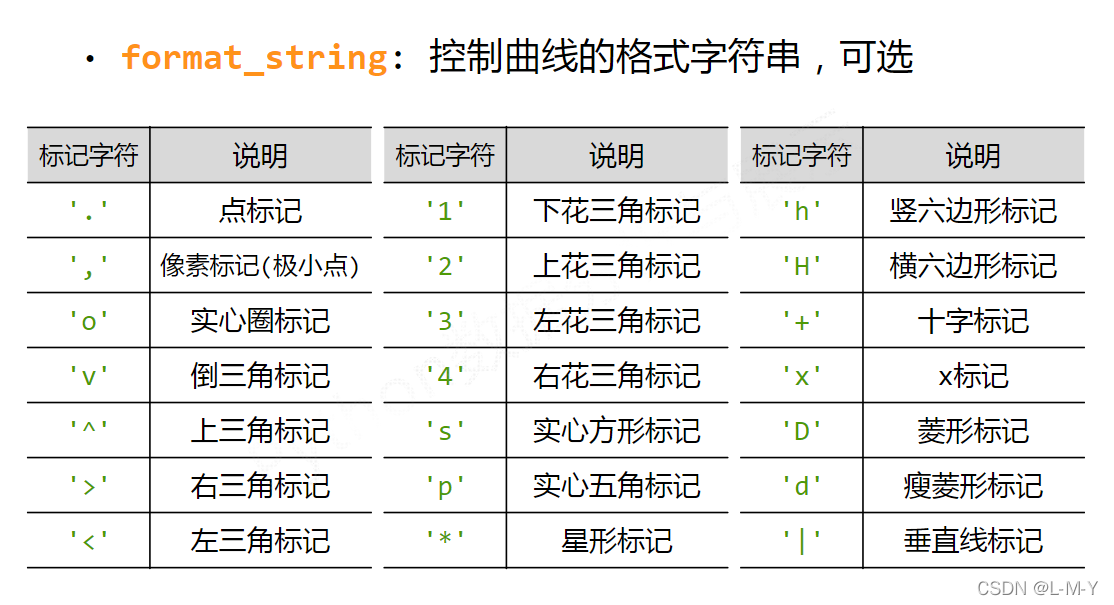
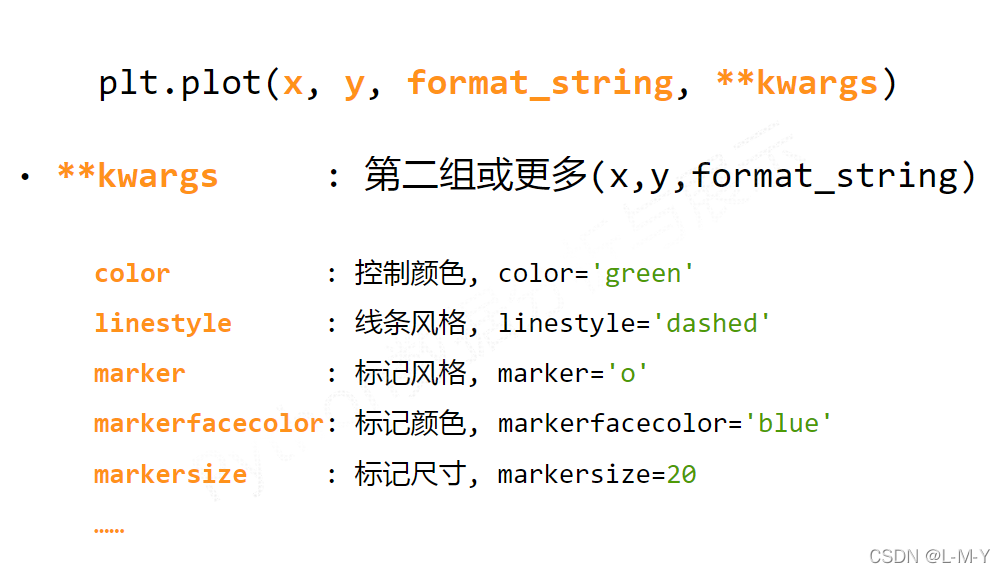
3.plot函数画图语法规则
plot函数参数:plot([x],y,[format],**kwargs)

各类语法太多啦,偷几张MOOC的图放上来~

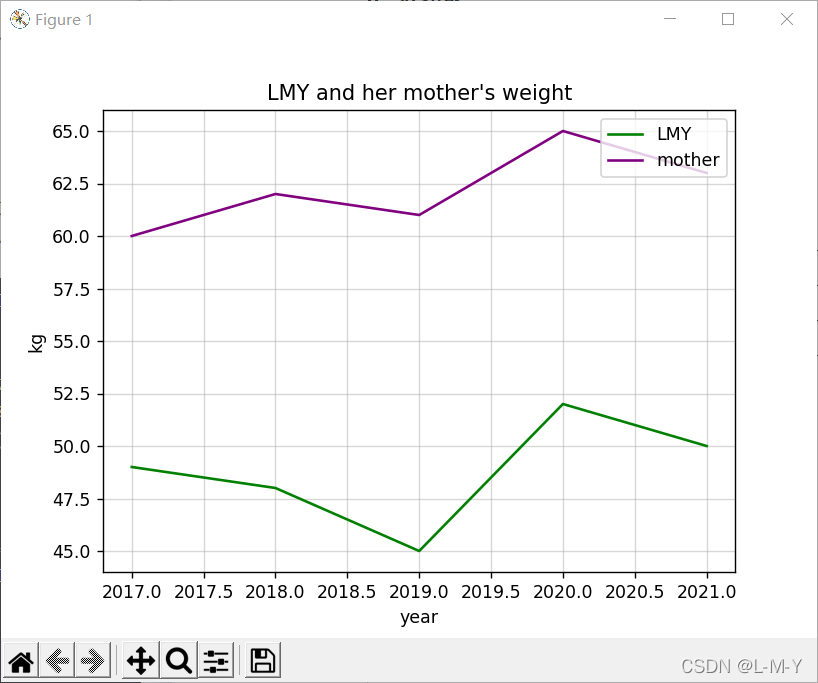
4.折线图
from matplotlib import pyplot as plt
#生成数据
#横坐标数据从2017到2022,第三个参数可控制步长,可写可不写
x = range(2017, 2022)
#y对应纵坐标的值
y1 = [49, 48, 45, 52, 50]
y2 = [60, 62, 61, 65, 63]
#生成图形
plt.title("LMY and her mother's weight")
plt.xlabel('year')
plt.ylabel('kg')
plt.plot(x, y1, color='green', label='LMY')
plt.plot(x, y2, color='purple', label='mother')
plt.grid(alpha=0.5)
plt.legend(loc='upper right')
#显示图形
plt.show()
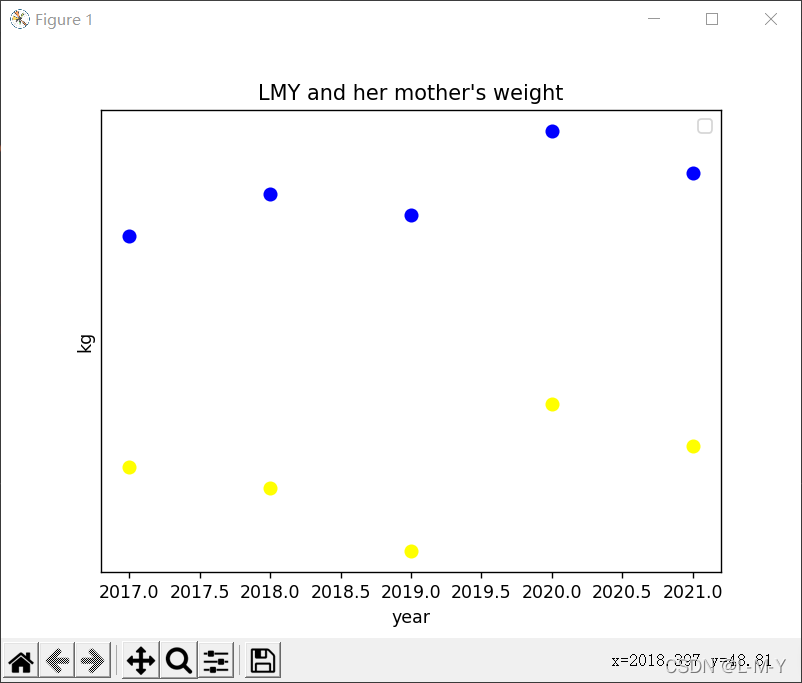
4.散点图
from matplotlib import pyplot as plt
import numpy as np

# 生成数据
# 横坐标数据从2017到2022,第三个参数可控制步长,可写可不写
x = range(2017, 2022)
# y对应纵坐标的值
y1 = [49, 48, 45, 52, 50]
y2 = [60, 62, 61, 65, 63]
# 生成图形
plt.title("LMY and her mother's weight")
plt.xlabel('year')
plt.ylabel('kg')
# 点的大小
area = np.pi*4**2
plt.scatter(x, y1, s=area, c='yellow', alpha=1)
plt.scatter(x, y2, s=area, c='blue', alpha=1)
plt.legend()
plt.yticks(())
plt.show()
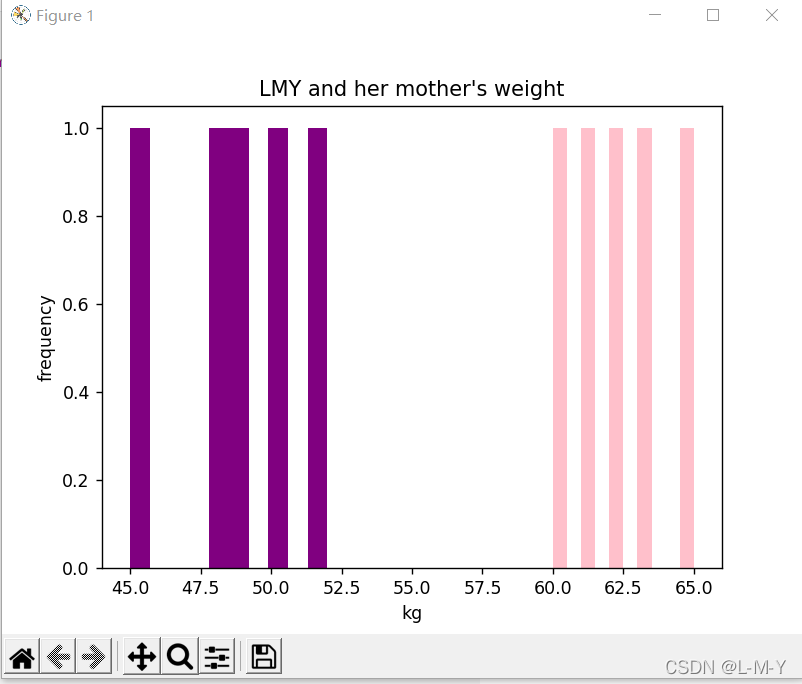
5.直方图
from matplotlib import pyplot as plt
import numpy as np

# 生成数据
# 横坐标数据从2017到2022,第三个参数可控制步长,可写可不写
x = [2017, 2018, 2019, 2020, 2021]
# y对应纵坐标的值
y1 = [49, 48, 45, 52, 50]
y2 = [60, 62, 61, 65, 63]
# 生成图形
plt.title("LMY and her mother's weight")
plt.ylabel('frequency')
plt.xlabel('kg')
# 点的大小
plt.hist(y1, bottom=None, color='purple')
plt.hist(y2, bottom=None, color='pink')
plt.show()

# n, bins, patches = plt.hist(arr, bins=50, normed=1, facecolor='green', alpha=0.75)
'''
arr:需要计算直方图的一维数组
bins:直方图的柱数,可选项,默认为10
normed:是否将得到的直方图向量归一化,默认为0
facecolor:直方图颜色
alpha:透明度
'''
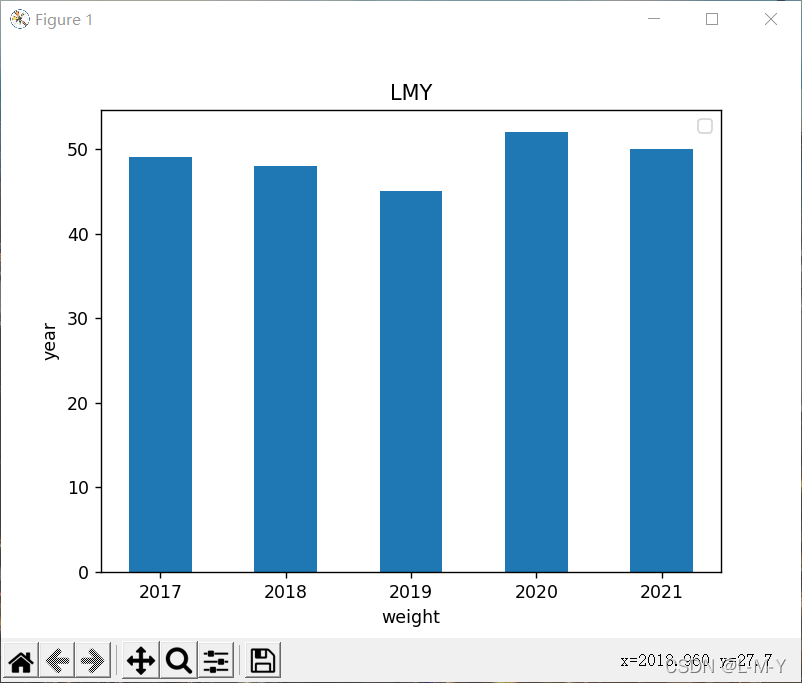
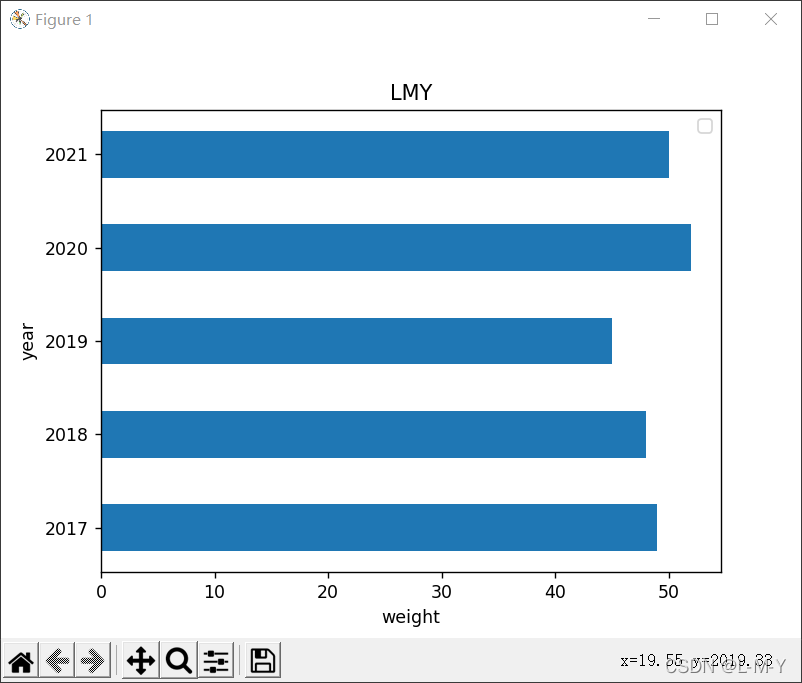
6.条形图
纵向
from matplotlib import pyplot as plt
import numpy as np

arr = np.arange(2017, 2022)
x = [49, 48, 45, 52, 50]  # x轴
y = [2017, 2018, 2019, 2020, 2021]
rect = plt.bar(arr, x, width=0.5)
plt.title('LMY')
plt.xlabel('weight')
plt.ylabel('year')
plt.legend()

plt.show()
横向
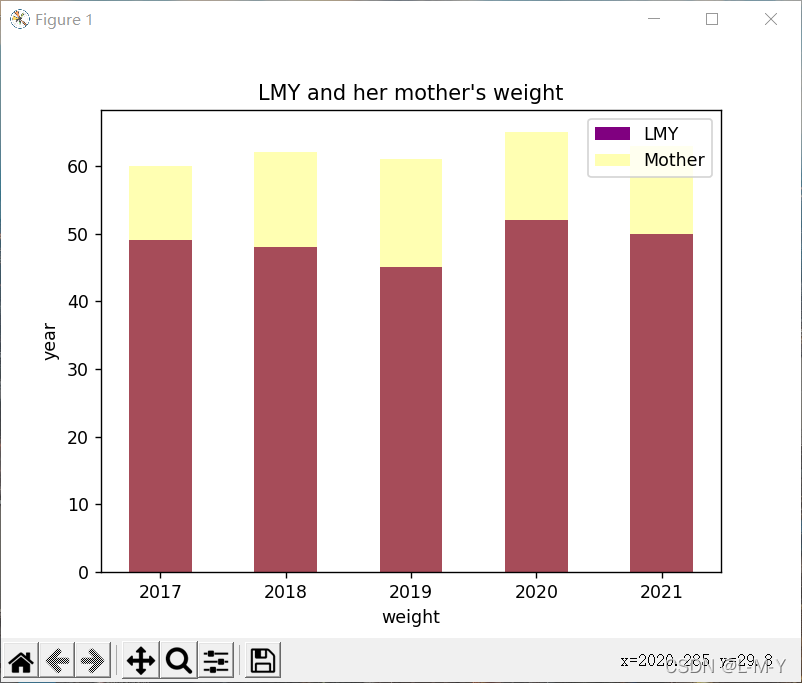
多条
from matplotlib import pyplot as plt
import numpy as np

arr = np.arange(2017, 2022)
x1 = [49, 48, 45, 52, 50]  # x轴
x2 = [60, 62, 61, 65, 63]
y = [2017, 2018, 2019, 2020, 2021]
rects1 = plt.bar(arr, x1, 0.5, color='purple', label='LMY')
rects2 = plt.bar(arr, x2, 0.5, color='yellow', label='Mother', alpha=0.3)
plt.title("LMY and her mother's weight")
plt.xlabel('weight')
plt.ylabel('year')
plt.legend()

plt.show()
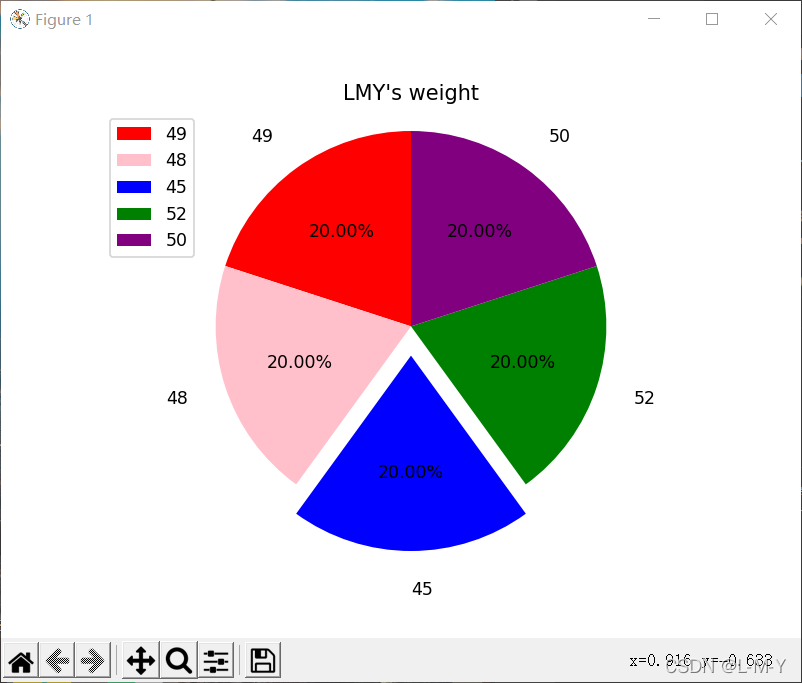
7.饼图
from matplotlib import patches, pyplot as plt
import numpy as np

label_list = ['49', '48', '45', '52', '50']
size = [20, 20, 20, 20, 20]
# 各部分的颜色
color = ['red', 'pink', 'blue', 'green', 'purple']
explode = [0, 0, 0.15, 0, 0]

patches, l_text, p_text = plt.pie(size, explode=explode, colors=color, labels=label_list,
                                  labeldistance=1.2, autopct="%1.2f%%", shadow=False, startangle=90, pctdistance=0.6)
plt.axis('equal')
plt.title("LMY's weight")
plt.legend(loc='upper left')
plt.show()
到此这篇关于python matplotlib各种画图的文章就介绍到这了,更多相关python matplotlib画图内容请搜索脚本之家以前的文章或继续浏览下面的相关文章希望大家以后多多支持脚本之家!
相关文章
![python array中关于[a,b,c]的使用方式](//img.jbzj.com/images/xgimg/bcimg0.png) 这篇文章主要介绍了python array中关于[a,b,c]的使用方式,具有很好的参考价值,希望对大家有所帮助,如有错误或未考虑完全的地方,望不吝赐教2024-02-02
这篇文章主要介绍了python array中关于[a,b,c]的使用方式,具有很好的参考价值,希望对大家有所帮助,如有错误或未考虑完全的地方,望不吝赐教2024-02-02 这篇文章主要为大家介绍了TensorFlow人工智能学习按索引取数据及维度变换的示例详解,有需要的朋友可以借鉴参考下,希望能够有所帮助2021-11-11
 这篇文章主要介绍了python程序超时处理方式,具有很好的参考价值,希望对大家有所帮助,如有错误或未考虑完全的地方,望不吝赐教2023-08-08
 这篇文章主要介绍了python pow函数的底层实现原理介绍,具有很好的参考价值,希望对大家有所帮助。一起跟随小编过来看看吧2021-03-03
 这篇文章主要介绍了python插入排序算法的实现代码,大家参考使用吧2013-11-11
 这篇文章主要介绍了用python拟合等角螺线的实现示例,文中通过示例代码介绍的非常详细,对大家的学习或者工作具有一定的参考学习价值,需要的朋友们下面随着小编来一起学习学习吧2019-12-12
 datetime 是 Python 内置的日期时间处理库,它包含了处理日期、时间、时间间隔等的类和函数,这篇文章主要介绍了Python datetime库函数的详解,需要的朋友可以参考下2023-07-07
python3:excel操作之读取数据并返回字典 + 写入的案例
这篇文章主要介绍了python3:excel操作之读取数据并返回字典 + 写入的案例,具有很好的参考价值,希望对大家有所帮助。一起跟随小编过来看看吧2020-09-09 这篇文章主要介绍了python中添加模块导入路径的方法 ,本文给大家介绍的非常详细,对大家的学习或工作具有一定的参考借鉴价值,需要的朋友可以参考下2021-02-02
 CSRF(Cross-site request forgery)攻击是一种常见的网络安全漏洞,它可以通过欺骗用户执行恶意请求来攻击 Web 应用程序,本篇文章将介绍python flask是如何预防CSRF攻击,需要的朋友可以参考下2024-04-04
![python array中关于[a,b,c]的使用方式](http://img.jbzj.com/images/xgimg/bcimg0.png)


最新评论