
python matplotlib画图时坐标轴重叠显示不全和图片保存时不完整的问题解决
更新时间:2022年07月01日 09:23:55 作者:每天都想躺平的大喵
最近工作中遇到了matplotlib保存图片坐标轴不完整的问题,所以这篇文章主要给大家介绍了关于python matplotlib画图时坐标轴重叠显示不全和图片保存时不完整问题的解决方法,需要的朋友可以参考下
问题
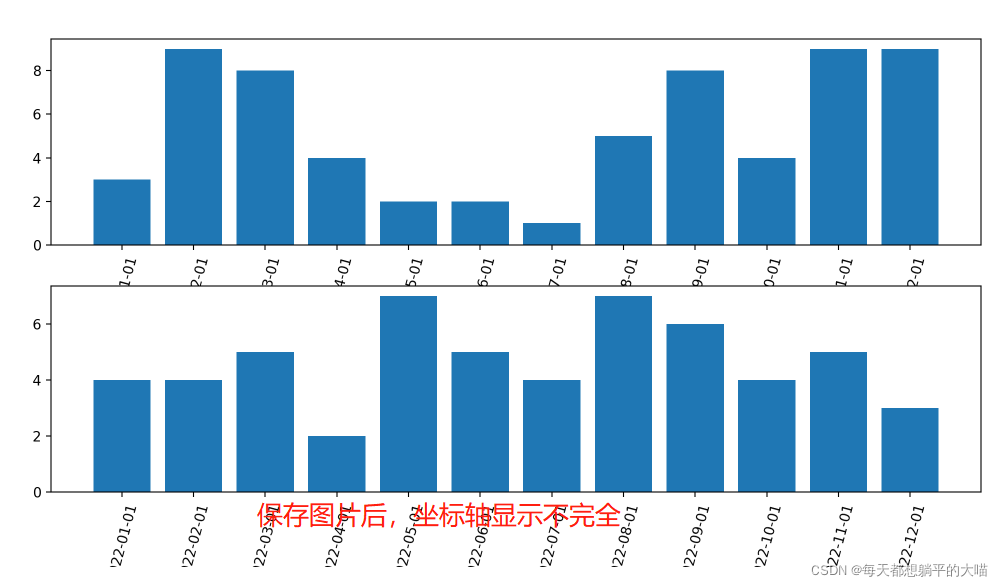
在使用matplotlib作图的时候,有的时候会遇到画图时坐标轴重叠,显示不全和图片保存时不完整的问题。如下:

解决方案
画图时重叠或者显示不全的问题
- 画图时加上参数设置
tight_layout=True - 画完所有子图后,设置
plt.tight_layout()
# 加上tight_layout=True 参数设置
fig, axes = plt.subplots(nrows=2, ncols=1, figsize=(12,6), tight_layout=True)
labels = ['2022-{}-01'.format(str(i).zfill(2)) for i in range(1,13)]
y1 = np.random.randint(low=1, high=10, size=12)
y2 = np.random.randint(low=1, high=10, size=12)
axes[0].bar(labels, y1)
axes[0].set_xticks(labels)
axes[0].set_xticklabels(labels, rotation=75)
axes[1].bar(labels, y2)
axes[1].set_xticks(labels)
axes[1].set_xticklabels(labels, rotation=75)
plt.savefig('test.png', dpi=200)
fig, axes = plt.subplots(nrows=2, ncols=1, figsize=(12,6))
labels = ['2022-{}-01'.format(str(i).zfill(2)) for i in range(1,13)]
y1 = np.random.randint(low=1, high=10, size=12)
y2 = np.random.randint(low=1, high=10, size=12)
axes[0].bar(labels, y1)
axes[0].set_xticks(labels)
axes[0].set_xticklabels(labels, rotation=75)
axes[1].bar(labels, y2)
axes[1].set_xticks(labels)
axes[1].set_xticklabels(labels, rotation=75)
plt.tight_layout()
# 这里加上plt.tight_layout(),记住要在画完所有子图后
plt.savefig('test.png', dpi=200)
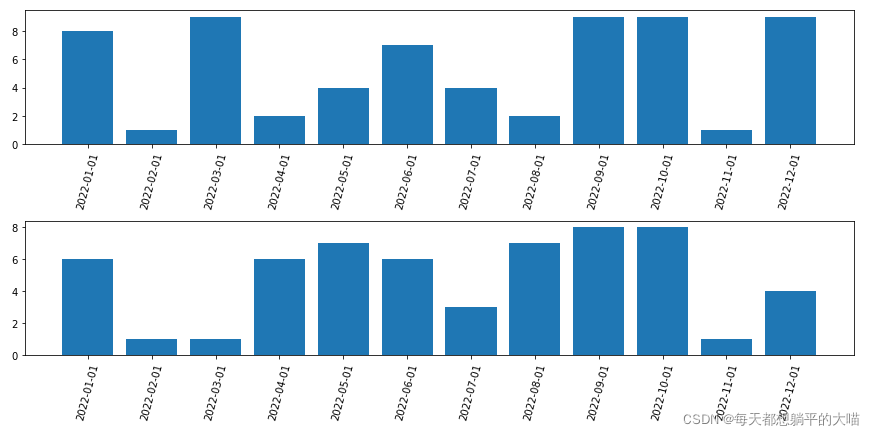
效果如下:
保存时图片不完整的问题
在plt.savefig中加入bbox_inches='tight’参数设置
fig, axes = plt.subplots(nrows=2, ncols=1, figsize=(12,6), tight_layout=True)
labels = ['2022-{}-01'.format(str(i).zfill(2)) for i in range(1,13)]
y1 = np.random.randint(low=1, high=10, size=12)
y2 = np.random.randint(low=1, high=10, size=12)
axes[0].bar(labels, y1)
axes[0].set_xticks(labels)
axes[0].set_xticklabels(labels, rotation=75)
axes[1].bar(labels, y2)
axes[1].set_xticks(labels)
axes[1].set_xticklabels(labels, rotation=75)
plt.savefig('test.png', dpi=600, bbox_inches='tight')
# savefig时加入bbox_inches='tight'参数设置
补充:使用matplotlib时如何让坐标轴完整显示所有的标签刻度
在使用matplotlib时,由于数据量过大,在默认设置下,使用plot等时,会将x,y轴的刻度按一定比例缩减掉一部分,如:1,2,3,4,5,6,7,8,9,10会显示成2,4,6,8,10等,解决方法是使用xticks()和yticks():
xticks(ticks=None, labels=None, **kwargs)
ticks:x轴显示的数值(类型:list),若为空,则x轴上不会显示任何数值;
labels:标签项,当ticks不为空时,labels内容将覆盖ticks的内容
**kwargs:控制标签内容的排版
Return:
- locs:返回x轴坐标列表
- labels:返回x轴标签列表
总结
到此这篇关于python matplotlib画图时坐标轴重叠显示不全和图片保存时不完整问题解决的文章就介绍到这了,更多相关matplotlib画图时坐标轴重叠显示不全内容请搜索脚本之家以前的文章或继续浏览下面的相关文章希望大家以后多多支持脚本之家!
相关文章
 这篇文章主要介绍了Selenium 4.2.0 标签定位8种方法,本文给大家介绍的非常详细,对大家的学习或工作具有一定的参考借鉴价值,需要的朋友可以参考下2022-06-06
Python Pandas pandas.read_sql_query函数实例用法分析
在本篇文章里小编给大家整理的是一篇关于Python Pandas pandas.read_sql_query函数实例用法分析内容,有兴趣的朋友们可以跟着学习下。2021-06-06 这篇文章主要为大家详细介绍了python实现数据写入excel表格,具有一定的参考价值,感兴趣的小伙伴们可以参考一下2018-03-03
 这篇文章主要介绍了Pycharm学生免费专业版安装教程的方法步骤,文中通过示例代码介绍的非常详细,对大家的学习或者工作具有一定的参考学习价值,需要的朋友们下面随着小编来一起学习学习吧2020-09-09
 JSON (JavaScript Object Notation) 是一种轻量级的数据交换格式,下面这篇文章主要给大家介绍了关于Python解析JSON数据的基本方法,文中通过实例代码介绍的非常详细,需要的朋友可以参考下2022-01-01
 这篇文章主要介绍了python多线程+代理池爬取天天基金网、股票数据过程解析,文中通过示例代码介绍的非常详细,对大家的学习或者工作具有一定的参考学习价值,需要的朋友可以参考下2019-08-08
利用python numpy+matplotlib绘制股票k线图的方法
这篇文章主要介绍了利用python numpy+matplotlib绘制股票k线图的方法,文中通过示例代码介绍的非常详细,对大家的学习或者工作具有一定的参考学习价值,需要的朋友们下面随着小编来一起学习学习吧2019-06-06
终端能到import模块 解决jupyter notebook无法导入的问题
这篇文章主要介绍了在终端能到import模块 而在jupyter notebook无法导入的问题,具有很好的参考价值,希望对大家有所帮助。一起跟随小编过来看看吧2021-03-03 今天小编就为大家分享一篇python跳过第一行快速读取文件内容的实例,具有很好的参考价值,希望对大家有所帮助。一起跟随小编过来看看吧2018-07-07
 这篇文章主要介绍了Python编程中对文件和存储器的读写示例,包括使用cPickle储存器存储对象的例子,需要的朋友可以参考下2016-01-01


最新评论