
echarts学习之如何给饼图中间添加文字
更新时间:2023年03月29日 08:57:27 作者:King_960725
这篇文章主要介绍了echarts学习之如何给饼图中间添加文字问题,具有很好的参考价值,希望对大家有所帮助。如有错误或未考虑完全的地方,望不吝赐教
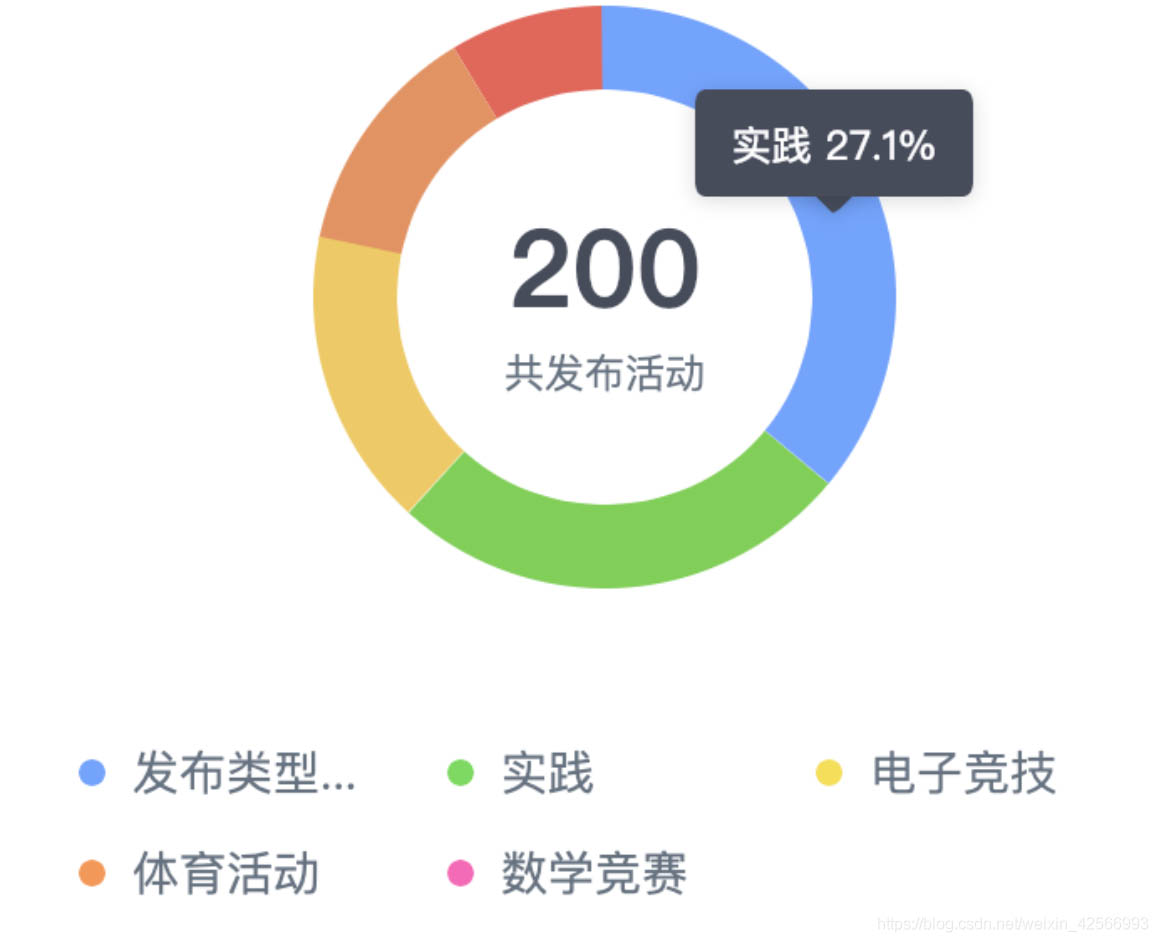
先看要实现的饼图效果图
方法一:使用series
series: [
    {
        type:'pie',
        radius: ['50%', '70%'],
        center: ['50%', '40%'],
        avoidLabelOverlap: false,
        label: {
            normal: {
                show: true,
                position: 'center',
                color:'#4c4a4a',
                formatter: '{total|' + this.total +'}'+ '\n\r' + '{active|共发布活动}',
                rich: {
                    total:{
                        fontSize: 35,
                        fontFamily : "微软雅黑",
                        color:'#454c5c'
                    },
                    active: {
                        fontFamily : "微软雅黑",
                        fontSize: 16,
                        color:'#6c7a89',
                        lineHeight:30,
                    },
                }
            },
            emphasis: {//中间文字显示
                show: true,
            }
        },
        lableLine: {
            normal: {
                show: false
            },
            emphasis: {
                show: true
            },
            tooltip: {
                show: false
            }
        },
        data:this.pieDataList2
    }
]
只要在formatter里这样写就可以啦,rich里面写你需要的样式即可
formatter: '{total|' + this.total +'}'+ '\n\r' + '{active|共发布活动}'方法二:使用title
title: {
    text:this.total,//主标题文本
    subtext:'共发布活动',//副标题文本
    left:'center',
    top:'32%',
    textStyle:{
    fontSize: 38,
    color:'#454c5c',
    align:'center'
    },
    subtextStyle:{
        fontFamily : "微软雅黑",
        fontSize: 16,
        color:'#6c7a89',
    }
},
title配置如下
var myChart=echarts.init(document.getElementById('main'));
//init初始化接口,返回ECharts实例,其中dom为图表所在节点

var option = {
    //标题
    title : {
        show:true,//显示策略,默认值true,可选为:true(显示) | false(隐藏)
        text: '主标题',//主标题文本,'\n'指定换行
        link:'',//主标题文本超链接,默认值true
        target: null,//指定窗口打开主标题超链接,支持'self' | 'blank',不指定等同为'blank'(新窗口)
        subtext: '副标题',//副标题文本,'\n'指定换行
        sublink: '',//副标题文本超链接
        subtarget: null,//指定窗口打开副标题超链接,支持'self' | 'blank',不指定等同为'blank'(新窗口)
        x:'center'//水平安放位置,默认为'left',可选为:'center' | 'left' | 'right' | {number}(x坐标,单位px)
        y: 'top',//垂直安放位置,默认为top,可选为:'top' | 'bottom' | 'center' | {number}(y坐标,单位px)
        textAlign: null,//水平对齐方式,默认根据x设置自动调整,可选为: left' | 'right' | 'center
        backgroundColor: 'rgba(0,0,0,0)',//标题背景颜色,默认'rgba(0,0,0,0)'透明
        borderColor: '#ccc',//标题边框颜色,默认'#ccc'
        borderWidth: 0,//标题边框线宽,单位px,默认为0(无边框)
        padding: 5,//标题内边距,单位px,默认各方向内边距为5,接受数组分别设定上右下左边距
        itemGap: 10,//主副标题纵向间隔,单位px,默认为10
        textStyle: {//主标题文本样式{"fontSize": 18,"fontWeight": "bolder","color": "#333"}
            fontFamily: 'Arial, Verdana, sans...',
            fontSize: 12,
            fontStyle: 'normal',
            fontWeight: 'normal',
        },
        subtextStyle: {//副标题文本样式{"color": "#aaa"}
            fontFamily: 'Arial, Verdana, sans...',
            fontSize: 12,
            fontStyle: 'normal',
            fontWeight: 'normal',
        },
        zlevel: 0,//一级层叠控制。默认0,每一个不同的zlevel将产生一个独立的canvas,相同zlevel的组件或图标将在同一个canvas上渲染。zlevel越高越靠顶层,canvas对象增多会消耗更多的内存和性能,并不建议设置过多的zlevel,大部分情况可以通过二级层叠控制z实现层叠控制。
        z: 6,//二级层叠控制,默认6,同一个canvas(相同zlevel)上z越高约靠顶层。
    },


    //提示框,鼠标悬浮交互时的信息提示
    tooltip : {
        trigger: 'item',
        formatter: "{a} <br/>{b} : {c} ({d}%)"
    },
    //图例,每个图表最多仅有一个图例
    legend: {
        orient: 'vertical',
        left: 'left',
        data: ['第一部分','第二部分','第三部分','第四部分']
    },
    // 系列列表,每个系列通过 type 决定自己的图表类型
    series : [
        {
            name: '访问',
            type: 'pie',
            radius : '62%',
            center: ['50%', '65%'],/
            minAngle:'15',
            data:[
                {name:"第一部分",value:4},
                {name:"第二部分",value:7},
                {name:"第三部分",value:3},
                {name:"第四部分",value:1},
            ],
            itemStyle: {
                normal:{
                    label:{
                        show:true,
                        formatter: "{b} :\n  {c} \n ({d}%)",
                        position:"inner"
                    }
                }
            }
        }
    ],
};
myChart.setOption(option);// 为echarts对象加载数据
总结
以上为个人经验,希望能给大家一个参考,也希望大家多多支持脚本之家。
相关文章
 JsDom编程小结,需要进行dom操作的朋友可以参考下。2011-08-08
 这篇文章主要介绍了JavaScript实现俄罗斯方块游戏过程分析及源码分享,本文分解了游戏规则、实现过程、难点分析及实现源码,需要的朋友可以参考下2015-03-03
 平时我们经常会需要将字符转换为各种不同的格式,例如钱:0元需要转换为0.00显示;需要转换为16进制显示的数,这样的例子有很多2011-08-08
 这篇文章主要介绍了js获取今天、昨天、明天的日期函数代码,需要的朋友可以参考下2023-05-05
 这篇文章主要为大家详细介绍了js实现拖拽与碰撞检测,文中示例代码介绍的非常详细,具有一定的参考价值,感兴趣的小伙伴们可以参考一下2020-09-09
 其实这个example也很简单, 就是根据where后的条件批量修改element的属性,此处为Img元素2010-05-05
 这篇文章主要介绍了JavaScript获取table中某一列的值的方法,需要的朋友可以参考下2014-05-05
 与许多其他编程语言一样,JavaScript 也在不断发展,小编今天就为大家介绍ES13中添加的最新功能,并查看其用法示例以更好地理解它们,有需要的小伙伴可以了解下2023-09-09
 今天,小子再提供一种使用Flash进行跨域操作的方法。众所周之,其实Flash的跨域操作也是有限制的,不过,Flash的跨域配置比简单,只需要在站点根目录下放置crossdomain.xml即可。2010-12-12
 今天小编就为大家分享一篇Layui表格行工具事件与数据回填方法,具有很好的参考价值,希望对大家有所帮助。一起跟随小编过来看看吧2019-09-09


最新评论