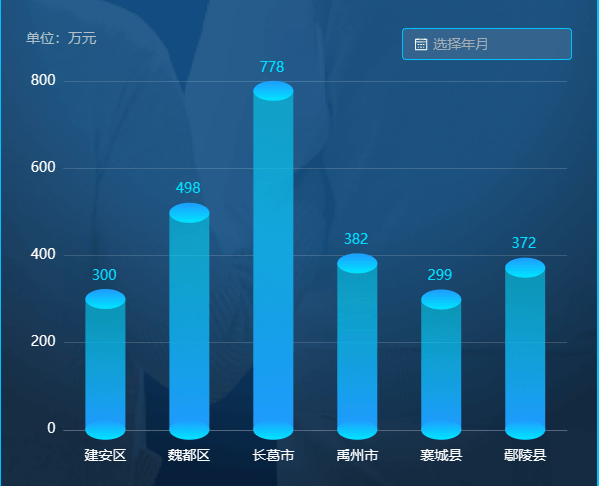
ECharts绘制立体柱状图(圆柱体)详细示例

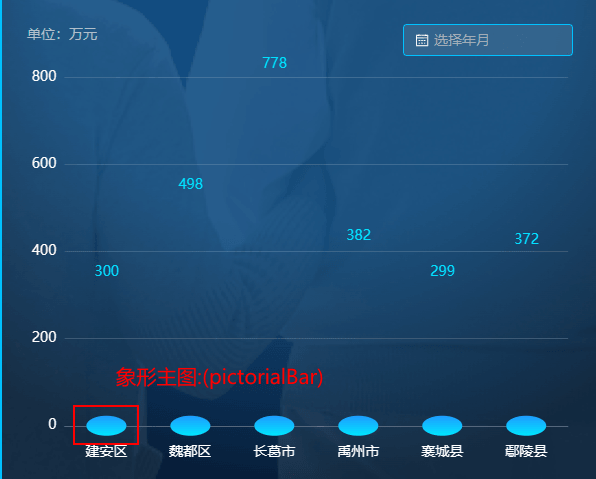
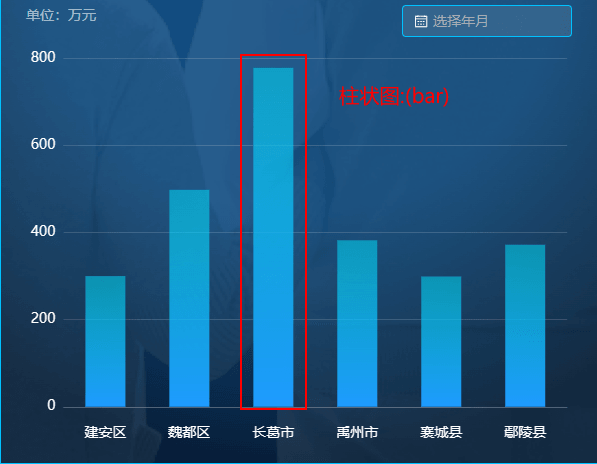
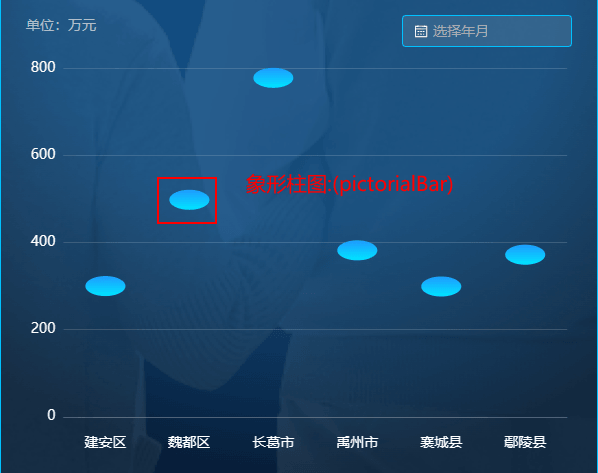
绘制这个立体的圆柱体柱状图主要由三块组成: 底部 主体 顶部


实现这种效果主要是: ECharts中的 series 属性,通过两种不同类型的图表组合而成.
其中里面的柱体渐变色是通过 ECharts中内置的渐变色生成器 echarts.graphic.LinearGradient
可以用来设置渐变色.
itemStyle: { // 图形样式
    // echarts.graphic.LinearGradient(echarts内置的渐变色生成器)
    // 4个参数用于配置渐变色的起止位置,这4个参数依次对应右 下 左 上
    color: new echarts.graphic.LinearGradient(0, 0, 0, 1, [
       // 这里 offset: 0 1 ,表示从下往上的渐变色
        {
             offset: 0, // 0%处的颜色
             color: "rgba(31,155,255,1)"
        },
        {
             offset: 1, // 100%处的颜色
             color: "rgba(0,229,255,1)"
        }
    ])
 }
在柱状图中我们也可以使用下面来实现渐变色:
Documentation - Apache ECharts
itemStyle: { // 图形样式
    // color支持(rgb(255,255,255)、rgba(255,255,255,1)、#fff,也支持渐变色和纹理填充)
    // 下面就是使用线性渐变
    color: {
        "x": 0,
        "y": 0,
        "x2": 0,
        "y2": 1,
        "type": "linear",
        "global": false,
        "colorStops": [{
            "offset": 0, // 0%处的颜色
            "color": "rgba(0,229,255,0.5)"
        },
        {
            "offset": 1, // 100%处的颜色
             "color": "#1F9BFF"
         }]
    }
}
完整代码:
<div id="fftjChart"></div>

let fftjChart = null;

onMounted(()=>{
    fftjChart = echarts.init(document.getElementById('fftjChart'));
    drawFftjChart();

    window.addEventListener('resize', () => {
        fftjChart.resize();
    })
})

function drawFftjChart() {
        let yData = [300, 498, 778, 382, 299, 372];
        fftjChart.setOption({
            grid: {
                left: '5%',
                right: '5%',
                top: '5%',
                bottom: '5%',
                containLabel: true
            },
            tooltip: {
                trigger: 'item',
                formatter: function (parms) {
                    return parms.marker + " " + parms.name + ":" + parms.value + "万元";
                }
            },
            xAxis: {
                type: 'category', // category(坐标轴类型)
                data: ['建安区', '魏都区', '长葛市', '禹州市', '襄城县', '鄢陵县'],
                axisTick: { // 坐标轴刻度相关配置
                    show: false // 是否显示坐标轴刻度
                },
                axisLine: { // 坐标轴轴线相关配置
                    lineStyle: { // 坐标轴轴线样式
                        color: 'rgba(255,255,255,0.15)' // 坐标轴轴线颜色
                    }
                },
                axisLabel: { // 坐标轴刻度标签相关配置
                    color: '#ffffff',
                    fontSize: 14,
                    margin: 20
                }
            },
            yAxis: {
                type: 'value', // value(数值轴,适用于连续数据)
                axisTick: { // 坐标轴刻度相关配置
                    show: false  // 是否显示坐标轴刻度
                },
                axisLine: { // 坐标轴轴线相关配置
                    show: false // 是否显示坐标轴轴线
                },
                axisLabel: { // 坐标轴刻度标签相关配置
                    color: '#ffffff',
                    fontSize: 14
                },
                splitLine: { // 坐标轴在 grid 区域中的分隔线
                    lineStyle: { // 分割线配置
                        color: 'rgba(255,255,255,0.15)' // 分割线颜色
                    }
                }
            },
            series: [
                // 底部的椭圆形(象形柱图):pictorialBar
                {
                    type: "pictorialBar", // pictorialBar(象形柱图)
                    label: { // 图形上的文本标签,可用于说明图像的一些数据信息,比如值,名称等
                        show: true, //是否显示标签
                        position: ['17', '-30'], // 标签的位置(可以是绝对的像素值或者百分比['50%','50%',也可以是top,left等])
                        color: '#01E4FF',
                        fontSize: 14
                    },
                    symbolSize: [40, 20], // 图形的大小用数组分别比表示宽和高,也乐意设置成10相当于[10,10]
                    symbolOffset: [0, 10], // 图形相对于原本位置的偏移
                    z: 12, // 象形柱状图组件的所有图形的 z 值.控制图形的前后顺序.z 值小的图形会被 z 值大的图形覆盖.
                    itemStyle: { // 图形样式
                        // echarts.graphic.LinearGradient(echarts内置的渐变色生成器)
                        // 4个参数用于配置渐变色的起止位置,这4个参数依次对应右 下 左 上
                        color: new echarts.graphic.LinearGradient(0, 0, 0, 1, [
                            // 这里 offset: 0 1 ,表示从下往上的渐变色
                            {
                                offset: 0, // 0%处的颜色
                                color: "rgba(31,155,255,1)"
                            },
                            {
                                offset: 1, // 100%处的颜色
                                color: "rgba(0,229,255,1)"
                            }
                        ])
                    },
                    data: yData
                },
                // 中间的长方形柱状图(柱状图):bar
                {
                    type: 'bar', // 柱状图
                    barWidth: 40, // 柱条的宽度,不设时自适应
                    barGap: '0%', // 柱子与柱子之间的距离
                    itemStyle: { // 图形样式
                        // color支持(rgb(255,255,255)、rgba(255,255,255,1)、#fff,也支持渐变色和纹理填充)
                        // 下面就是使用线性渐变
                        color: {
                            "x": 0,
                            "y": 0,
                            "x2": 0,
                            "y2": 1,
                            "type": "linear",
                            "global": false,
                            "colorStops": [{
                                "offset": 0, // 0%处的颜色
                                "color": "rgba(0,229,255,0.5)"
                            }, {
                                "offset": 1, // 100%处的颜色
                                "color": "#1F9BFF"
                            }]
                        }
                    },
                    data: yData
                },
                // 顶部的椭圆形(象形柱图):pictorialBar
                {
                    type: "pictorialBar",
                    symbolSize: [40, 20],
                    symbolOffset: [0, -10],
                    z: 12,
                    symbolPosition: "end",
                    itemStyle: {
                        color: new echarts.graphic.LinearGradient(0, 0, 0, 1, [
                            {
                                offset: 0,
                                color: "rgba(31,155,255,1)"
                            },
                            {
                                offset: 1,
                                color: "rgba(0,229,255,1)"
                            }
                        ], false)
                    },
                    data: yData
                }
            ]
        });
    }
总结
到此这篇关于ECharts绘制立体柱状图(圆柱体)的文章就介绍到这了,更多相关ECharts绘制立体柱状图内容请搜索脚本之家以前的文章或继续浏览下面的相关文章希望大家以后多多支持脚本之家!
相关文章

让JavaScript中setTimeout支持链式操作的方法
这篇文章主要介绍了让JavaScript中setTimeout支持链式操作的方法,本文直接给出代码实例,需要的朋友可以参考下2015-06-06
JavaScript 实现普通数组数据转化为树形数据结构的步骤说明
在 JavaScript 中,将普通数组数据转化为树形结构的数据是一个常见的任务,特别是在处理层级数据(例如分类、组织结构等)时,本文展示如何将一个扁平的数组转化为树形数据结构,感兴趣的朋友一起看看吧2024-12-12
详解微信开发中snsapi_base和snsapi_userinfo及静默授权的实现
这篇文章主要介绍了详解微信开发中snsapi_base和snsapi_userinfo及静默授权的实现的相关资料,需要的朋友可以参考下2017-03-03
JavaScript数据结构yocto queue队列链表代码分析
这篇文章主要为大家介绍了JavaScript数据结构yocto queue队列链表代码分析,有需要的朋友可以借鉴参考下,希望能够有所帮助,祝大家多多进步,早日升职加薪2022-12-12


最新评论