
Python中模块graphviz使用入门
graphviz 是一个用于创建和操作图形(如流程图、网络图等)的 Python 库。它依赖于 Graphviz 软件包,后者是一个开源的图形可视化软件。graphviz 库允许你从 Python 脚本中生成 Graphviz 的点文件(DOT 文件),并渲染成图像。
以下是使用 graphviz 的基本步骤:
1.安装
1.1 安装 Graphviz 软件首先,你需要在你的系统上安装 Graphviz 软件包。你可以从 Graphviz 官网 下载并安装它。安装完成后,确保 dot 命令在你的系统路径中可用。
1.2 安装 Python 的 graphviz 库你可以使用 pip 来安装 Python 的 graphviz 库:
pip install graphviz
2. 基本用法
该graphviz模块提供了两个类:Graph和 Digraph。它们分别以DOT语言为无向图和有向图创建图描述。它们具有相同的 API。通过实例化一个new Graph或 Digraphobject 创建一个图形:
from graphviz import Digraph

dot = Digraph(comment='The Round Table')

print(dot)
输出如下信息
// The Round Table
digraph {
}
然后我们可以添加点和边,通过node()和edge()或edges()来实现。
from graphviz import Digraph

dot = Digraph(comment='The Round Table')
dot.node('A', 'King Arthur')
dot.node('B', 'Sir Bedevere the Wise')
dot.node('L', 'Sir Lancelot the Brave')

dot.edges(['AB', 'AL'])
dot.edge('B', 'L', constraint='false')
print(dot.source)
生成的源代码如下:
// The Round Table
digraph {
    A [label="King Arthur"]
    B [label="Sir Bedevere the Wise"]
    L [label="Sir Lancelot the Brave"]
    A -> B
    A -> L
    B -> L [constraint=false]
}
最后我们可以通过如下代码保存图像pdf文件,并显示。通过设置view=True将自动使用系统默认的文件类型的查看器应用程序打开生成的文件(PDF,PNG,SVG等)。
dot.render('test-output/round-table.gv', view=True) 
2.1 输出图像格式
要使用与默认PDF 不同的输出文件格式,请format在创建Graph或 Digraph对象时使用参数:
from graphviz import Graph

g = Graph(format='png')
或者在基本用法的例子中在输出中添加format='jpg’便可以获得jpg图像。
dot.render('test-output/round-table.gv',format='jpg', view=True) 如果是想设置输出图像的dpi,需要在创建Graph或Digraph对象时,设置dpi参数。
from graphviz import Graph

g = Graph(format='png')
g.graph_attr['dpi'] = '300'
2.2 图像style设置
使用graph_attr,node_attr和 edge_attr参数更改默认外观的图表,点和连接线。
from graphviz import Digraph

ps = Digraph(name='pet-shop', node_attr={'shape': 'plaintext'},format='png')
ps.node('parrot')
ps.node('dead')
ps.edge('parrot', 'dead')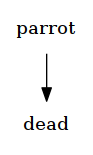
2.3 属性
要设置图中的所有后续图形,点或边的树形,请使用attr()方法,如下所示:
from graphviz import Digraph
from graphviz import Graph
ni = Graph('ni',format='jpg')

ni.attr('node', shape='rarrow')
ni.node('1', 'Ni!')
ni.node('2', 'Ni!')

ni.node('3', 'Ni!', shape='egg')

ni.attr('node', shape='star')
ni.node('4', 'Ni!')
ni.node('5', 'Ni!')
ni.attr(rankdir='LR')

ni.edges(['12', '23', '34', '45'])
print(ni.source)
ni.view()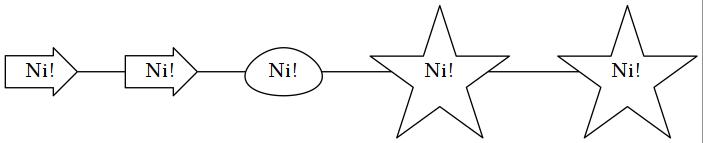
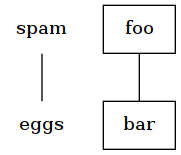
2.4 子图和聚类
图和有向图对象有一个subgraph()-用于向实例添加子图的方法。
有两种方法可以使用它:使用与唯一参数(其内容作为子图添加)类型相同的现成图形对象,或者省略图形参数(返回上下文管理器,以便在with块中更优雅地定义子图内容)。
第一个用法选项,只有graph作为参数:
from graphviz import Digraph
from graphviz import Graph
p = Graph(name='parent', node_attr={'shape': 'plaintext'},format='png')
p.edge('spam', 'eggs')

c = Graph(name='child', node_attr={'shape': 'box'})
c.edge('foo', 'bar')

p.subgraph(c)
p.view()
第二次使用,带有with-block(忽略graph参数):
p = Graph(name='parent')
p.edge('spam', 'eggs')

with p.subgraph(name='child', node_attr={'shape': 'box'}) as c:
    c.edge('foo', 'bar')
两者结果相同如下图所示:
3 实例
代表的实例图像如下所示
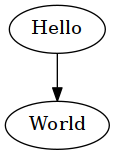
- 有向图
代码
from graphviz import Digraph
g = Digraph('G', filename='hello.gv',format='png')
g.edge('Hello', 'World')
g.view()
结果如图所示:
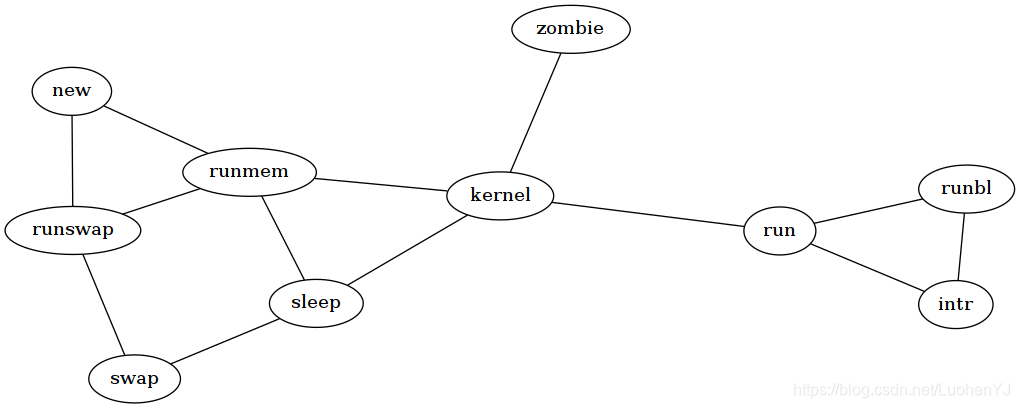
- 无向图
代码
from graphviz import Graph

g = Graph('G', filename='process.gv', engine='sfdp',format='png')

g.edge('run', 'intr')
g.edge('intr', 'runbl')
g.edge('runbl', 'run')
g.edge('run', 'kernel')
g.edge('kernel', 'zombie')
g.edge('kernel', 'sleep')
g.edge('kernel', 'runmem')
g.edge('sleep', 'swap')
g.edge('swap', 'runswap')
g.edge('runswap', 'new')
g.edge('runswap', 'runmem')
g.edge('new', 'runmem')
g.edge('sleep', 'runmem')

g.view()
结果如图所示:
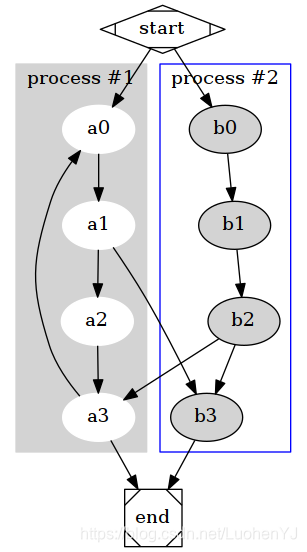
- 子图
代码
from graphviz import Digraph

g = Digraph('G', filename='cluster.gv',format='png')

# NOTE: the subgraph name needs to begin with 'cluster' (all lowercase)
#       so that Graphviz recognizes it as a special cluster subgraph

with g.subgraph(name='cluster_0') as c:
    c.attr(style='filled', color='lightgrey')
    c.node_attr.update(style='filled', color='white')
    c.edges([('a0', 'a1'), ('a1', 'a2'), ('a2', 'a3')])
    c.attr(label='process #1')

with g.subgraph(name='cluster_1') as c:
    c.attr(color='blue')
    c.node_attr['style'] = 'filled'
    c.edges([('b0', 'b1'), ('b1', 'b2'), ('b2', 'b3')])
    c.attr(label='process #2')

g.edge('start', 'a0')
g.edge('start', 'b0')
g.edge('a1', 'b3')
g.edge('b2', 'a3')
g.edge('a3', 'a0')
g.edge('a3', 'end')
g.edge('b3', 'end')

g.node('start', shape='Mdiamond')
g.node('end', shape='Msquare')

g.view()
结果如图所示:
4 如何进一步使用python graphviz
python graphviz官方文档如下:
在实际使用时,参考官方实例就行。
实际上graphviz画一些流程图即可,而且需要较大的调整参数。因此如果非紧急绘图建议使用visio。
到此这篇关于Python中模块graphviz使用入门的文章就介绍到这了,更多相关Python 模块graphviz使用内容请搜索脚本之家以前的文章或继续浏览下面的相关文章希望大家以后多多支持脚本之家!
相关文章
 熟悉python语言,以及学会python的编码方式。熟悉python库,遇到开发任务的时候知道如何去找对应的模块。知道如何查找和获取第三方的python库,以应付开发任务2013-02-02
 R语言和Python在数据分析方法都各有所长,两者现在可以说是都非常热门的,那么这篇文章就来给大家总结介绍关于R语言和Python数据分析的相关资料,并给大家推荐了一些相关的书籍学习,需要的朋友可以参考借鉴,下面随着小编来一起看看吧。2017-11-11
 Meshgrid函数在二维与三维空间中用于生成坐标网格,便于进行图像处理和空间数据分析,二维情况下,默认使用笛卡尔坐标系,而三维meshgrid则涉及不同的坐标轴取法,在三维情况下,可能会出现坐标轴排列序混乱2024-09-09
 在本篇文章里小编给大家整理的是关于python字典的常用方法以及相关知识点内容,需要的朋友们参考下。2019-07-07
 这篇文章主要介绍了numpy多维数组索引的问题,具有很好的参考价值,希望对大家有所帮助。如有错误或未考虑完全的地方,望不吝赐教2023-05-05
 这篇文章主要介绍了Python压缩和解压缩zip文件,本文直接给出实例代码,需要的朋友可以参考下2015-02-02
 这篇文章主要为大家详细介绍了利用Opencv中的Houghline方法进行直线检测,文中示例代码介绍的非常详细,具有一定的参考价值,感兴趣的小伙伴们可以参考一下2018-02-02
Python利用matplotlib.pyplot.boxplot()绘制箱型图实例代码
相信大家应该都知道Python绘制箱线图主要用matplotlib库里pyplot模块里的boxplot()函数,下面这篇文章主要给大家介绍了关于Python利用matplotlib.pyplot.boxplot()绘制箱型图的相关资料,需要的朋友可以参考下2022-08-08
Python操作word常见方法示例【win32com与docx模块】
这篇文章主要介绍了Python操作word常见方法,结合实例形式分析了Python使用win32com模块与docx模块操作word的相关实现技巧及相关注意事项,需要的朋友可以参考下2018-07-07
Python使用logging模块创建和处理.log文件的多种方法
本文介绍了在Python中创建和处理.log文件的方法,推荐使用内置的logging模块,并详细描述了基础版、进阶版和专业版的实现方案,其中包括文件创建、日志级别、大小切割、日期切割、格式定制、多输出目标、高级功能等关键功能的说明和实现方式,需要的朋友可以参考下2026-04-04


最新评论