
VUE+elementui组件在table-cell单元格中绘制微型echarts图
更新时间:2020年04月20日 16:53:10 作者:吃三个汉堡
这篇文章主要介绍了VUE+elementui组件在table-cell单元格中绘制微型echarts图,文中通过示例代码介绍的非常详细,对大家的学习或者工作具有一定的参考学习价值,需要的朋友们下面随着小编来一起学习学习吧
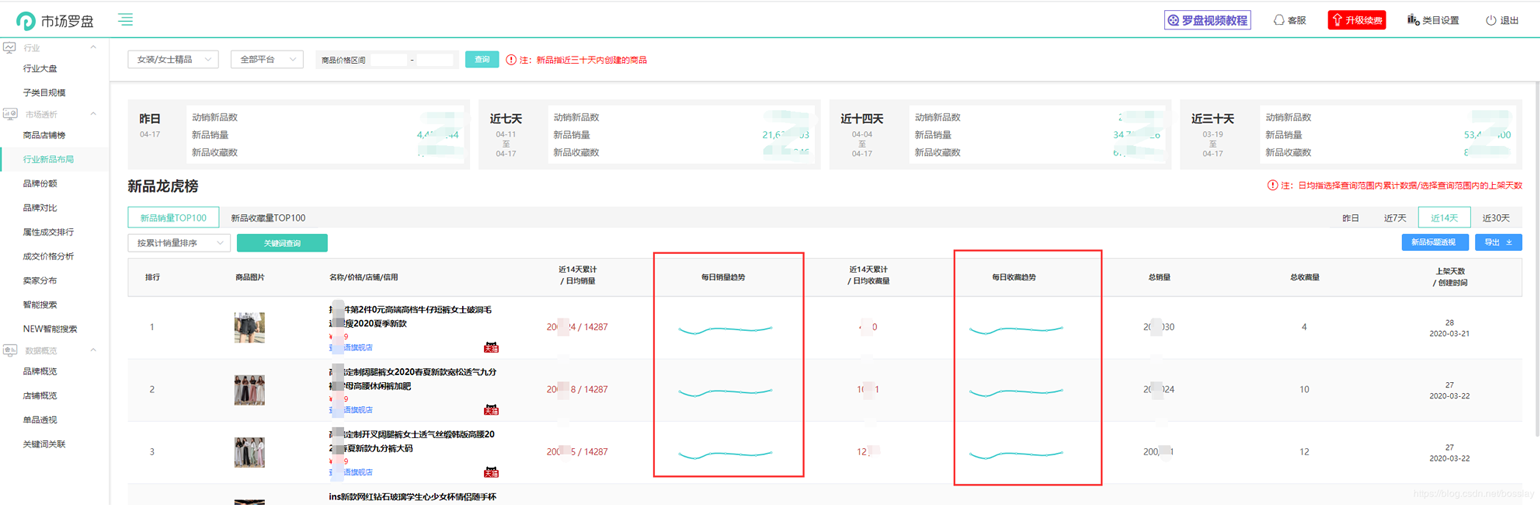
需求效果图示例

实际完成效果图
 **
**
代码实现
注:table表格为二次封装的子组件
-在table表格中 根据 scope.$index动态设置元素的id ,便于指定单元格的echarts初始化;
-在单元格中触发一个方法,传入当前的scope.row数据或者指定其他数据,并且传入 scope.$index 以及一个字符串便于识别当前是哪条数据的charts
-在方法中绘制echarts**
<el-table-column align="center">
<template slot="header" slot-scope="scope">
<div v-if="tableTitle == 'sale'">
<p v-if="dateType != '1'">
近{{ dateType }}天累计
<br />
/ 日均销量
</p>
<p v-if="dateType == '1'">昨日累计销量</p>
</div>
<div v-if="tableTitle == 'fav'">
<p v-if="dateType != '1'">
近{{ dateType }}天累计
<br />
/ 日均收藏量
</p>
<p v-if="dateType == '1'">昨日累计收藏</p>
</div>
</template>
<div slot-scope="scope" style="white-space:nowrap;">
<span class="xiao-red-color">{{ realRowName(scope.row, '0') || '-' }}</span>
<span v-if="dateType != '1'" class="xiao-red-color">
/
{{ isNaN(realRowName(scope.row, '0')) ? '-' : (realRowName(scope.row, '0') / (parseInt(dateType) - calcShelfTime(scope.row.real_created_time, '0') < 0 ? parseInt(dateType): calcShelfTime(scope.row.real_created_time, '0'))).toFixed(0)}}
</span>
</div>
</el-table-column>
<el-table-column label="每日销量趋势" align="center" v-if="dateType != '1'">
<template slot-scope="scope">
{{ drawEcharts(scope.row, scope.$index, 'sale') }}
<div :id="`tiger-sale-trend-index` + scope.$index" class="tiger-trend-charts"></div>
</template>
</el-table-column>
绘制echarts的方法(数据仅为示例,实际开发根据传进来的scope.row数据)注意此处初始化echarts对象时采用VUE的this.$nextTick方法,以防获取不到未渲染的节点元素。
drawEcharts() {
   //绘制趋势echarts
   // console.log(arguments)
   let option = {
    tooltip: {
     trigger: 'axis'
    },
    // legend: {
    //  data: ['每日30天销量分析']
    // },
    grid: {
     left: '10px',
     right: '30px',
     top: '40px',
     bottom: '10px',
     containLabel: true
    },
    xAxis: {
     show: false,
     type: 'category',
     boundaryGap: false,
     data: ['03-21', '03-22', '03-23', '03-24', '03-25', '03-26', '03-27']
    },
    yAxis: {
     show: false,
     type: 'value'
    },
    series: [
     {
      name: '每日30天销量分析',
      type: 'line',
      data: [120, 500, 101, 86, 173, 230, 6]
     }
    ]
   };
   let chartId = 'tiger-' + arguments[2] + '-trend-index' + arguments[1];
   this.$nextTick(() => {
    let myChart = this.echarts.init(document.getElementById(chartId), 'macarons');
    myChart.setOption(option);
    myChart.resize();
   });
  },
AND 不要忘记设置echarts的高度,否则一辈子也出不来图形(示例,根据实施开发调整)
&-frame {
  display: flex;
  flex-flow: column nowrap;
  justify-content: space-between;

  .price-bar {
   color: red !important;
  }
  .tiger-trend-charts {
   height: 60px;
   min-width: 100px;
  }
 }
到此这篇关于VUE+elementui组件在table-cell单元格中绘制微型echarts图的文章就介绍到这了,更多相关VUE elementui 单元格echarts图内容请搜索脚本之家以前的文章或继续浏览下面的相关文章希望大家以后多多支持脚本之家!
相关文章
 本篇文章主要介绍了详解VueRouter进阶之导航钩子和路由元信息,具有一定的参考价值,感兴趣的小伙伴们可以参考一下2017-09-09
vue3的setup语法如何自定义v-model为公用hooks
这篇文章主要介绍了vue3的setup语法如何自定义v-model为公用hooks,文章分为两个部分介绍,简单介绍vue3的setup语法如何自定义v-model和如何提取v-model语法作为一个公用hooks2022-07-07 这篇文章主要为大家详细介绍了vue实现在线翻译功能,具有一定的参考价值,感兴趣的小伙伴们可以参考一下2019-09-09
vue3 reactive定义的引用类型直接赋值导致数据失去响应式问题
这篇文章主要介绍了vue3 reactive定义的引用类型直接赋值导致数据失去响应式问题,具有很好的参考价值,希望对大家有所帮助。如有错误或未考虑完全的地方,望不吝赐教2023-06-06 Vuex 是一个专为 Vue.js 应用程序开发的状态管理模式。这篇文章主要介绍了web前端vue:vuex单独一文件使用方式,需要的朋友可以参考下2018-01-01
 这篇文章主要为大家详细介绍了vue+echarts实带渐变效果的折线图,文中示例代码介绍的非常详细,具有一定的参考价值,感兴趣的小伙伴们可以参考一下2022-04-04
 这篇文章主要介绍了在Vue中使用Select选择器拼接label的操作,具有很好的参考价值,希望对大家有所帮助。一起跟随小编过来看看吧2020-10-10
全面解析vue router 基本使用(动态路由,嵌套路由)
路由,其实就是指向的意思,当我点击页面上的home按钮时,页面中就要显示home的内容,如果点击页面上的about 按钮,页面中就要显示about 的内容。这篇文章主要介绍了vue router 基本使用 ,需要的朋友可以参考下2018-09-09 这篇文章主要介绍了详解vue中的computed的this指向问题,小编觉得挺不错的,现在分享给大家,也给大家做个参考。一起跟随小编过来看看吧2018-12-12
go-gin-vue3-elementPlus带参手动上传文件的案例代码
这篇文章主要介绍了go-gin-vue3-elementPlus带参手动上传文件的案例代码,本文结合实例代码给大家介绍的非常详细,对大家的学习或工作具有一定的参考借鉴价值,需要的朋友参考下吧2023-11-11


最新评论