
R语言ggplot2图例修改超详细介绍
前言
大家经常对ggplot2中的图例不满意,想要各种修改,今天就介绍下图例的各种修改细节,基本上常用的操作都涉及到了!
library(ggplot2)
library(gcookbook)
移除图例
提供3种方法可以在ggplot2中移除图例。
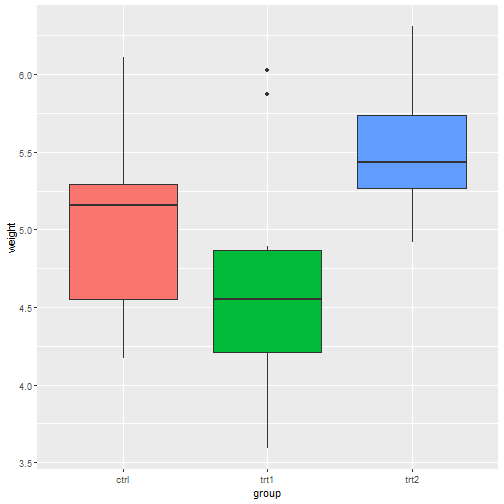
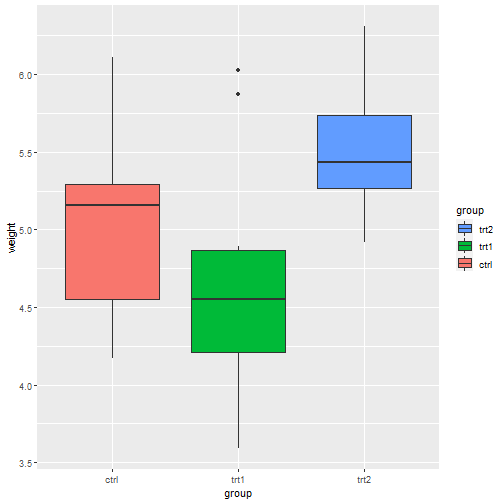
# 基本图形
pg_plot <- ggplot(PlantGrowth, aes(x = group, y = weight, fill = group)) +
  geom_boxplot()

pg_plot

# 首先可以使用guides()函数移除图例
pg_plot +
  guides(fill = "none")
然后可以在scale_**函数中移除,这里是fill,你要根据自己的情况换成shape、color等。
pg_plot+scale_fill_discrete(guide = "none")

第3种方法是在theme中移除。
pg_plot+theme(legend.position = "none")

改变图例位置
也是在theme中更改,
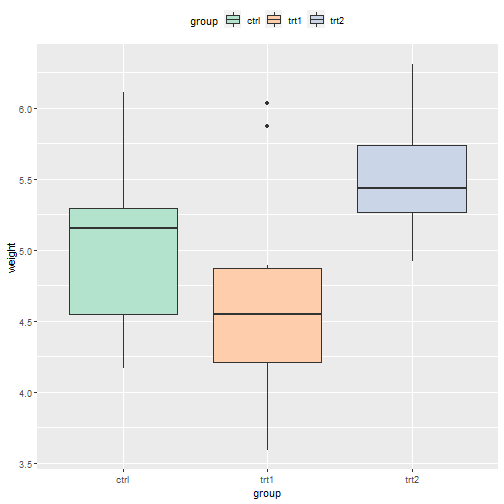
pg_plot <- ggplot(PlantGrowth, aes(x = group, y = weight, fill = group)) +
  geom_boxplot() +
  scale_fill_brewer(palette = "Pastel2")

pg_plot +
  theme(legend.position = "top") # 放在顶部
legend.position的参数可以是left、right、top、bottom,还可以是坐标。
pg_plot+theme(legend.position = c(0.8,0.3))
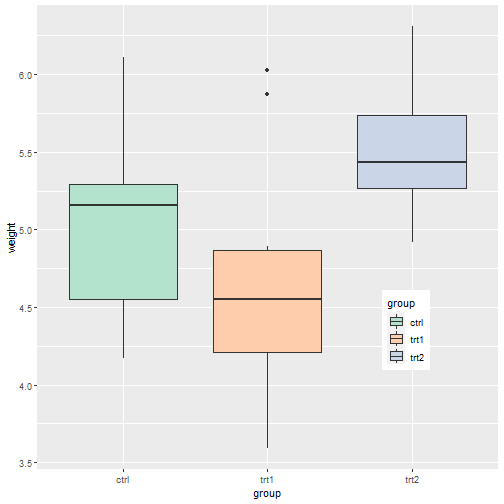
在ggplot2中,左下角的坐标是c(0,0),右上角的坐标是c(1,1),你可以自己设置想要放置的位置。需要注意的是,你设置的这个坐标是图例中心点的坐标,可以通过legend.justification设置图例的哪个位置放在你的坐标上。
# 图例右下角,放在画布右下角
pg_plot +
  theme(legend.position = c(1, 0), legend.justification = c(1, 0))

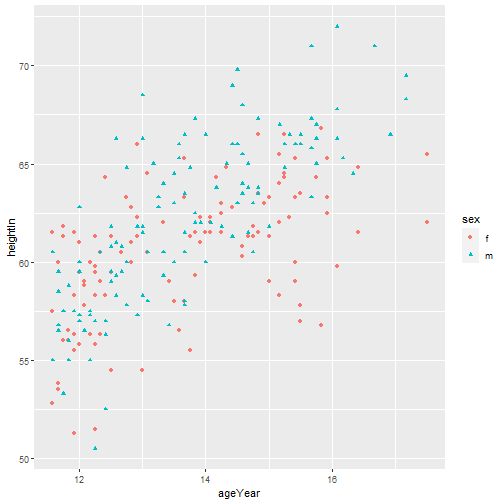
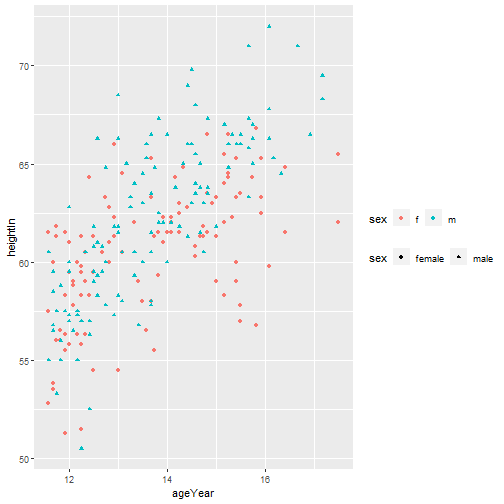
p <- ggplot(heightweight, aes(x=ageYear, y=heightIn, shape=sex, colour=sex))+geom_point()
p
两个图例更改为水平排列:
p + scale_shape_discrete(label = c("female","male")) +
  theme(legend.direction = "horizontal")
修改图例的边框和背景
pg_plot+
  theme(legend.position = c(0.85,0.2))+
  theme(legend.background = element_rect(fill = "orange",color = "black"))
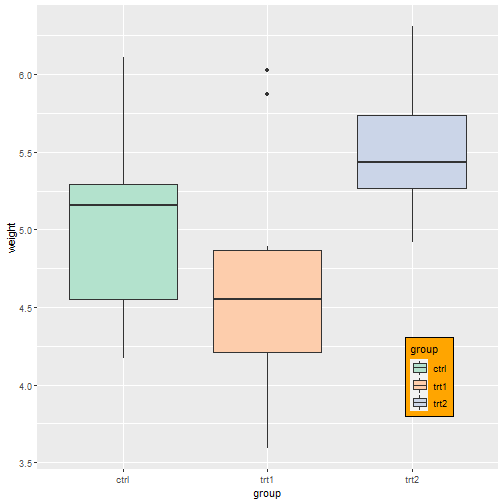
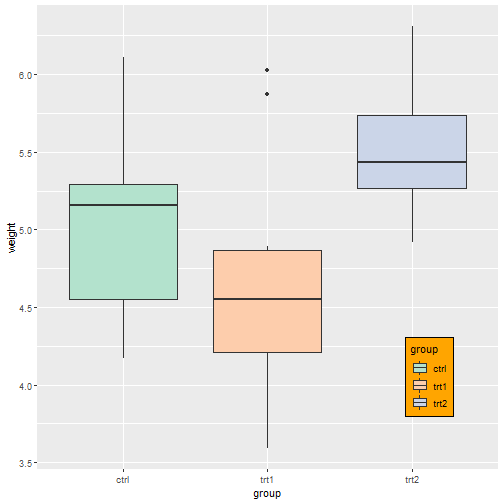
中间还有一部分是白色,需要另外一个参数修改:
pg_plot+
  theme(legend.position = c(0.85,0.2))+
  theme(legend.background = element_rect(fill = "orange",color = "black"),
        legend.key = element_rect(fill = "orange")
        )
改变图例顺序
pg_plot <- ggplot(PlantGrowth, aes(x = group, y = weight, fill = group)) +
  geom_boxplot()

pg_plot

# limits
pg_plot +
  scale_fill_discrete(limits = c("trt1", "trt2", "ctrl"))
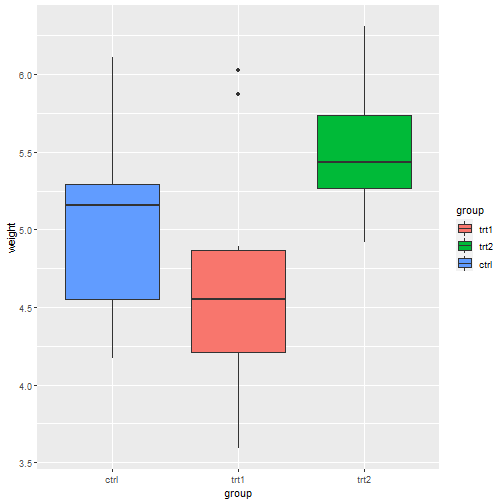
也可以在画图之前,通过因子化的方法把数据先排好序再画图哦。
反转图例顺序
2种方法。
pg_plot+scale_fill_discrete(guide = guide_legend(reverse = T))

pg_plot+guides(fill = guide_legend(reverse = T))
修改图例标题
2种方法。
pg_plot <- ggplot(PlantGrowth, aes(x = group, y = weight, fill = group)) +
  geom_boxplot()

pg_plot

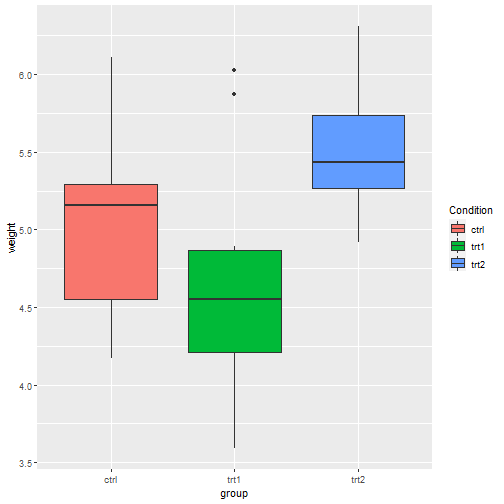
labs里面修改
pg_plot + labs(fill = "Condition")
在scale_*函数里面修改。
pg_plot+scale_fill_discrete(name = "hahah")

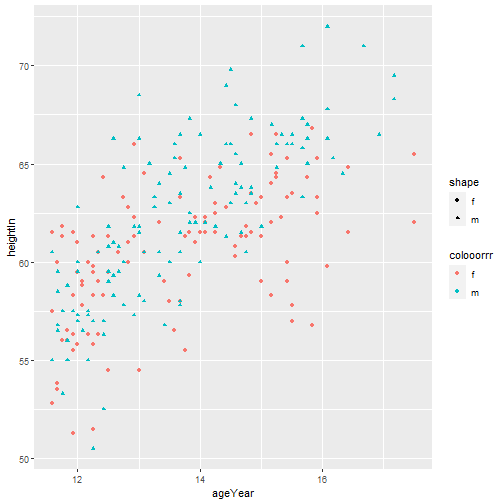
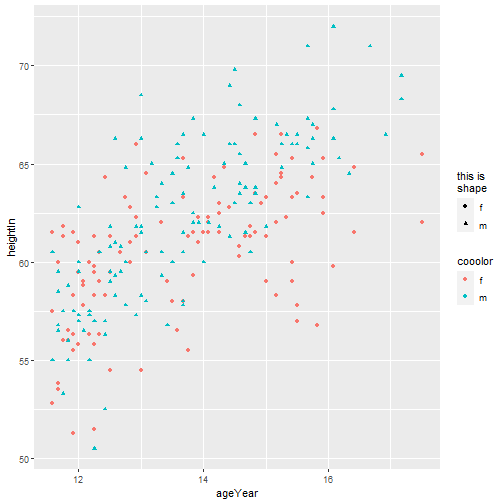
还有一种比较复杂的情况,如果多个一个变量映射给多个图形参数,或者有多个图例,怎么修改呢?像下面这个例子,sex和shape、color都有关。
p <- ggplot(heightweight, aes(x=ageYear, y=heightIn, shape=sex, colour=sex))+geom_point()
p

可以在scale_*函数中修改:
p + scale_shape_discrete(name = "shape")+
  scale_color_discrete(name = "colooorrr")
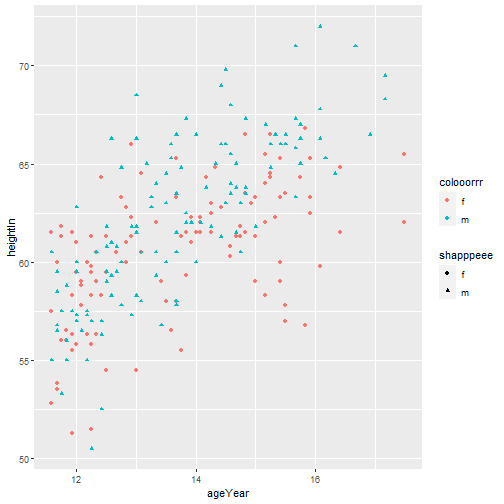
也可以在legend中修改:
p + labs(shape = "shapppeee",color = "colooorrr")
还可以在guides函数中修改:
p + guides(shape = guide_legend(title = "this is\nshape"),
           color = guide_legend(title = "cooolor")
           )
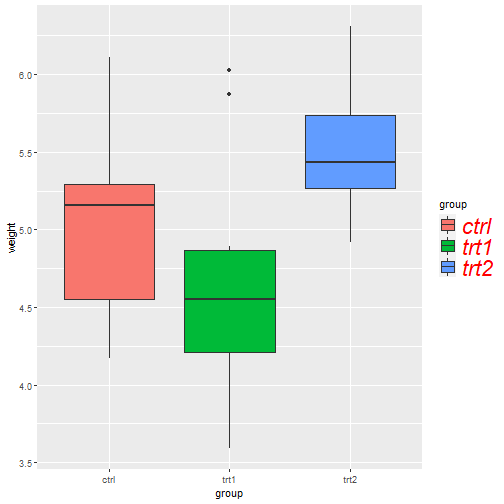
修改图例标题外观
pg_plot <- ggplot(PlantGrowth, aes(x = group, y = weight, fill = group)) +
  geom_boxplot()
pg_plot

可以在theme中修改:
pg_plot + theme(
  legend.title = element_text(
    face = "italic",
    family = "Times",
    colour = "red",
    size = 18
  )
)

也可以在guides中修改:
pg_plot +
  guides(fill = guide_legend(title.theme = element_text(
    face = "italic",
    family = "Times",
    colour = "red",
    size = 14))
  )

移除图例标题
pg_plot

可以在theme中修改,也可以在scale_xxx函数中修改,也可以在guides函数中修改。
pg_plot+theme(legend.title = element_blank())

pg_plot+scale_fill_discrete(name = NULL)

pg_plot+scale_fill_hue(guide = guide_legend(title = NULL))

pg_plot+guides(fill = guide_legend(title = NULL))

修改图例标签
pg_plot

pg_plot+scale_fill_discrete(labels = c("label1","label2","label3"))
修改图例标签外观
在theme中修改:
pg_plot +
  theme(legend.text = element_text(
    colour = "red",
    face = "italic",
    size = 22)
  )
总结
到此这篇关于R语言ggplot2图例修改的文章就介绍到这了,更多相关R语言ggplot2图例修改内容请搜索脚本之家以前的文章或继续浏览下面的相关文章希望大家以后多多支持脚本之家!
相关文章
 R语言提供了丰富的功能和扩展包来支持各种任务,默认R语言会将安装的扩展包存储在特定的目录中,有时我们希望将这个默认存储路径更改为其他位置,以便更好地组织和管理我们的包,这篇文章主要给大家介绍了关于RStudio中如何更改R包安装位置的相关资料,需要的朋友可以参考下2023-09-09
R语言数据可视化ggplot添加左右y轴绘制天猫双十一销售图
本篇文章主要介绍如何在R中,使用ggplot2包在一个图像上添加左右两个 y 轴刻度,并在同一个图像上绘制两个完全不一样的统计图,有需要的朋友可以借鉴参考下2021-11-11 这篇文章主要介绍了R studio 批量注释的快捷方式,具有很好的参考价值,希望对大家有所帮助。一起跟随小编过来看看吧2021-04-04
R语言修改下载安装包install.package的默认存储路径的操作方法
这篇文章主要介绍了R语言修改下载安装包install.package的默认存储路径的操作方法,本文给大家介绍的非常详细,对大家的学习或工作具有一定的参考借鉴价值,需要的朋友可以参考下2021-03-03 在本篇内容里小编给大家总结了关于R语言中因子的相关知识点以及相关实例内容,有兴趣的朋友们可以学习下。2021-04-04
 这篇文章主要介绍了R语言中na.fail和na.omit的用法,具有很好的参考价值,希望对大家有所帮助。一起跟随小编过来看看吧2021-04-04
 这篇文章主要介绍了如何用R语言绘制函数曲线图,帮助大家更好的理解和学习使用R语言,感兴趣的朋友可以了解下2021-03-03
 这篇文章主要介绍了R语言实现读取前n行数据的操作,具有很好的参考价值,希望对大家有所帮助。一起跟随小编过来看看吧2021-04-04
 这篇文章主要介绍了基于R语言xlsx安装遇到的问题及解决方案,具有很好的参考价值,希望对大家有所帮助。一起跟随小编过来看看吧2021-04-04
 这篇文章主要为大家介绍了R语言绘制Bubble Matrix气泡矩阵图的示例详解,有需要的朋友可以借鉴参考下,希望能够有所帮助祝大家多多进步2022-02-02


最新评论