
纯JAVASCRIPT图表动画插件Highcharts Examples
更新时间:2011年04月16日 16:43:28 作者:
官方提供免费的下载包以及详细的文档说明,非常的值得收藏。
What is Highcharts? 下载地址 https://www.jb51.net/jiaoben/24363.html
Highcharts is a charting library written in pure JavaScript, offering an easy way of adding interactive charts to your web site or web application. Highcharts currently supports line, spline, area, areaspline, column, bar, pie and scatter chart types.
Features

It works in all modern browsers including the iPhone/iPad and Internet Explorer from version 6. Standard browsers use SVG for the graphics rendering. In Internet Explorer graphics are drawn using VML.

.
Highcharts is solely based on native browser technologies and doesn't require client side plugins like Flash or Java. Furthermore you don't need to install anything on your server. No PHP or ASP.NET. Highcharts needs only two JS files to run: The highcharts.js core and either the jQuery or the MooTools framework. One of these frameworks is most likely already in use in your web page.
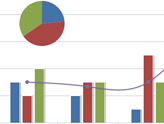
Highcharts supports line, spline, area, areaspline, column, bar, pie and scatter chart types. Any of these can be combined in one chart.
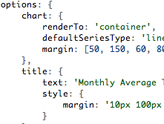
Setting the Highcharts configuration options requires no special programming skills. The options are given in a JavaScript object notation structure, which is basically a set of keys and values connected by colons, separated by commas and grouped by curly brackets.
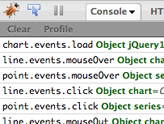
Through a full API you can add, remove and modify series, axes or points at any time after chart creation. Numerous events supply hooks for programming agains the chart. In combination with jQuery's or MooTools' Ajax API, this opens for solutions like live charts constantly updating with values from the server, user supplied data and more.
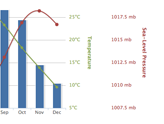
Sometimes you want to compare variables that are not the same scale - for example temperature versus rainfall and air pressure. Highcharts lets you assign an y axis for each series - or an x axis if you want to compare data sets of different categories. Each axis can be placed to the right or left, top or bottom of the chart. All options can be set individually, including reversing, styling and position.
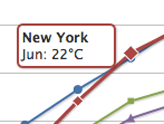
On hovering the chart Highcharts can display a tooltip text with information on each point and series. The tooltip follows as the user moves the mouse over the graph, and great efforts have been taken to make it stick to the nearest point as well as making it easy to read a point that is below another point.
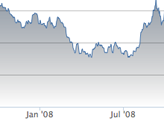
75% of all charts with an X and Y axis have a date-time X axis. Therefore Highchart is very intelligent about time values. With milliseconds axis units, Highcharts determines where to place the ticks so that they always mark the start of the month or the week, midnight and midday, the full hour etc.
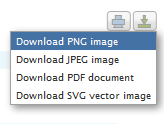
With the exporting module enabled, your users can export the chart to PNG, JPG, PDF or SVG format at the click of a button, or print the chart directly from the web page.
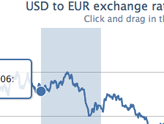
By zooming in on a chart you can examine an especially interesting part of the data more closely. Zooming can be in the X or Y dimension, or both.
Highcharts takes the data in a JavaScript array, which can be defined in the local configuration object, in a separate file or even on a different site. Furthermore, the data can be handled over to Highcharts in any form, and a callback function used to parse the data into an array.
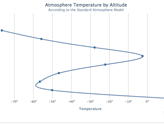
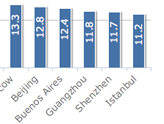
Sometimes you need to flip over your chart and make the X axis appear vertical, like for example in a bar chart. Reversing the axis, with the highest values appearing closest to origo, is also supported.
Highcharts is a charting library written in pure JavaScript, offering an easy way of adding interactive charts to your web site or web application. Highcharts currently supports line, spline, area, areaspline, column, bar, pie and scatter chart types.
Features
It works in all modern browsers including the iPhone/iPad and Internet Explorer from version 6. Standard browsers use SVG for the graphics rendering. In Internet Explorer graphics are drawn using VML.
.
Highcharts is solely based on native browser technologies and doesn't require client side plugins like Flash or Java. Furthermore you don't need to install anything on your server. No PHP or ASP.NET. Highcharts needs only two JS files to run: The highcharts.js core and either the jQuery or the MooTools framework. One of these frameworks is most likely already in use in your web page.
Highcharts supports line, spline, area, areaspline, column, bar, pie and scatter chart types. Any of these can be combined in one chart.
Setting the Highcharts configuration options requires no special programming skills. The options are given in a JavaScript object notation structure, which is basically a set of keys and values connected by colons, separated by commas and grouped by curly brackets.
Through a full API you can add, remove and modify series, axes or points at any time after chart creation. Numerous events supply hooks for programming agains the chart. In combination with jQuery's or MooTools' Ajax API, this opens for solutions like live charts constantly updating with values from the server, user supplied data and more.
Sometimes you want to compare variables that are not the same scale - for example temperature versus rainfall and air pressure. Highcharts lets you assign an y axis for each series - or an x axis if you want to compare data sets of different categories. Each axis can be placed to the right or left, top or bottom of the chart. All options can be set individually, including reversing, styling and position.
On hovering the chart Highcharts can display a tooltip text with information on each point and series. The tooltip follows as the user moves the mouse over the graph, and great efforts have been taken to make it stick to the nearest point as well as making it easy to read a point that is below another point.
75% of all charts with an X and Y axis have a date-time X axis. Therefore Highchart is very intelligent about time values. With milliseconds axis units, Highcharts determines where to place the ticks so that they always mark the start of the month or the week, midnight and midday, the full hour etc.
With the exporting module enabled, your users can export the chart to PNG, JPG, PDF or SVG format at the click of a button, or print the chart directly from the web page.
By zooming in on a chart you can examine an especially interesting part of the data more closely. Zooming can be in the X or Y dimension, or both.
Highcharts takes the data in a JavaScript array, which can be defined in the local configuration object, in a separate file or even on a different site. Furthermore, the data can be handled over to Highcharts in any form, and a callback function used to parse the data into an array.
Sometimes you need to flip over your chart and make the X axis appear vertical, like for example in a bar chart. Reversing the axis, with the highest values appearing closest to origo, is also supported.
Do you want to use Highcharts for a personal website, a school site or a non-profit organisation? Then you don't need the author's permission, just go on and use Highcharts. For commercial websites and projects, see
相关文章
 这篇文章主要介绍了原生js获取浏览器和对象宽高与jquery获取浏览器和对象宽高的方法关系对比,十分实用,需要的朋友可以参考下2015-04-04
 这篇文章主要介绍了jquery如何根据属性和index来查找属性值并操作,需要的朋友可以参考下2014-07-07
 本节让我们继续Jquery知识的了解:文档处理。文档处理主要是对HTML元素进行一些增操作,删除操作,复制操作,替换操作。2009-05-05
 jQuery的选择包含两种,一种是选择器,一种是筛选器。筛选器是对选择器选定的jQuery对象做进一步选择;记下来将详细介绍下筛选器children()感兴趣的你可不要错过了哈,或许本文的知识点对你有所帮助2013-02-02
 这篇文章主要介绍了jQuery的text()方法用法,以实例形式详细分析了jQuery的text()方法的定义、参数与具体用法,具有一定的参考借鉴价值,需要的朋友可以参考下2014-12-12
 或许在网络上你已经见过数百种通过jQuery实现的相册,但是我们发现的这些相册,他们有额外的东西,优雅和独特的创意!每个相册都是可在线预览和免费下载的。你可以为你的Web项目添加色彩。2011-02-02
 这篇文章主要为大家详细介绍了利用jquery制作简易的员工信息添加与删除,文中示例代码介绍的非常详细,具有一定的参考价值,感兴趣的小伙伴们可以参考一下2021-09-09
 这篇文章主要为大家详细介绍了jquery添加div实现消息聊天框,文中示例代码介绍的非常详细,具有一定的参考价值,感兴趣的小伙伴们可以参考一下2020-02-02
 这篇文章主要介绍了jQuery基于随机数解决中午吃什么去哪吃问题,涉及jQuery基于事件响应及随机数动态操作页面元素相关实现技巧,需要的朋友可以参考下2018-12-12
 这篇文章主要介绍了jQuery动态移除和添加背景图片的方法,结合实例形式分析了jQuery针对页面元素样式及事件响应的动态操作技巧,需要的朋友可以参考下2017-03-03


最新评论