
CSS极坐标的实例代码
发布时间:2021-06-03 16:57:51 作者:阿阿啊啊阿阿豪  我要评论
我要评论
项目有图表方面的需求,其中有做卫星定位的图形,需要制作极坐标来显示当前北半球或南半球的卫星分布情况,本文主要介绍了CSS极坐标的实例代码,分享给大家,感兴趣的可以了解一下
前言
项目有图表方面的需求,其中有做卫星定位的图形,需要制作极坐标来显示当前北半球或南半球的卫星分布情况。第一时间想到了echarts的极坐标,找到示例,虽然满足了部分需求,但是极坐标是由canvs画的,卫星有自己的编号,所以难以辨析每个点对应的卫星编号。于是就想到了自己去用CSS画极坐标
提示:以下是本篇文章正文内容,下面案例可供参考
一、示例
上面示例,下面echarts示例

二、设计步骤
1.纬度
几个div,设置圆角
2.经度
多条0.5px的边框,通过旋转实现
lines: [
        {
          id: 1,
          transform: "translateX(-50%) rotateZ(0deg) scaleX(0.4)",
          borderStyle: "solid",
          borderColor: "#333",
        },
        {
          id: 2,
          transform: "translateX(-50%) rotateZ(45deg) scaleX(0.4)",
          borderStyle: "dashed",
          borderColor: "#91cc75",
        },
        {
          id: 3,
          transform: "translateX(-50%) rotateZ(90deg) scaleX(0.4)",
          borderStyle: "solid",
          borderColor: "#333",
        },
        {
          id: 4,
          transform: "translateX(-50%) rotateZ(135deg) scaleX(0.4)",
          borderStyle: "dashed",
          borderColor: "#91cc75",
        },
      ],
3.卫星(点)
后台的数据只有经度和纬度。纬度很好做,按照90°的比例进行定位。经度用到旋转,注意不是直接在点上旋转,否则只是盒子旋转,需要在点外边套一个div进行旋转,如果需要美化,可以使点反方向旋转该角度达到编号是一个正的效果。
三、代码实现
代码是以vue的组件来写的,satellites就是极坐标的数据接口。
<template>
  <div class="polar">
    <div class="polar-main">
      <div class="polar-1">
        <div class="polar-2">
          <div class="polar-3">
            <p
              v-for="item in latitudes"
              :key="item.id"
              class="latitude"
              :style="{
                top: item.location.top,
                transform: item.location.transform,
              }"
            >
              {{ item.value }}
            </p>
            <div class="polar-center">
              <div class="satellites">
                <div v-for="item in satellites" :key="item.name">
                  <p
                    v-for="ele in item.distribution"
                    :key="ele.id"
                    class="satellite-box"
                    :style="{
                      transform: rotate(ele.long),
                    }"
                  >
                    <el-tooltip
                      class="item"
                      effect="dark"
                      :content="`经度:${ele.long} 纬度:${ele.lati}`"
                      placement="top-start"
                    >
                      <span
                        class="satellite"
                        :style="{
                          backgroundColor: ele.color,
                          top: top(ele.lati),
                          transform: rotate(-1 * ele.long),
                        }"
                        >{{ ele.id }}</span
                      >
                    </el-tooltip>
                  </p>
                </div>
              </div>
            </div>
          </div>
        </div>
      </div>
      <p
        v-for="item in lines"
        :key="item.id"
        class="line"
        :style="{
          transform: item.transform,
          borderStyle: item.borderStyle,
          borderColor: item.borderColor,
        }"
      ></p>
      <p
        v-for="item in longitudes"
        :key="item.id"
        class="longitude"
        :style="{
          top: item.location.top,
          left: item.location.left,
          transform: item.location.transform,
        }"
      >
        {{ item.value }}
      </p>
    </div>
    <div class="satellite-name"></div>
  </div>
</template>
<script>
export default {
  data() {
    return {
      lines: [
        {
          id: 1,
          transform: "translateX(-50%) rotateZ(0deg) scaleX(0.4)",
          borderStyle: "solid",
          borderColor: "#333",
        },
        {
          id: 2,
          transform: "translateX(-50%) rotateZ(45deg) scaleX(0.4)",
          borderStyle: "dashed",
          borderColor: "#91cc75",
        },
        {
          id: 3,
          transform: "translateX(-50%) rotateZ(90deg) scaleX(0.4)",
          borderStyle: "solid",
          borderColor: "#333",
        },
        {
          id: 4,
          transform: "translateX(-50%) rotateZ(135deg) scaleX(0.4)",
          borderStyle: "dashed",
          borderColor: "#91cc75",
        },
      ],
      longitudes: [
        {
          id: 5,
          value: "90°",
          location: {
            top: "50%",
            left: "100%",
            transform: "translateY(-50%)",
          },
        },
        {
          id: 6,
          value: "180°",
          location: {
            top: "100%",
            left: "50%",

            transform: "translateX(-50%)",
          },
        },
        {
          id: 7,
          value: "270°",
          location: {
            top: "50%",
            left: "0",

            transform: "translateX(-100%) translateY(-50%)",
          },
        },
        {
          id: 8,
          value: "360°",
          location: {
            top: "0",
            left: "50%",
            transform: "translateX(-50%) translateY(-100%)",
          },
        },
      ],
      latitudes: [
        {
          id: 1,
          value: "90°",
          location: {
            top: "50%",
            left: "0",
            transform: "translateY(-50%) translateX(50%)",
          },
        },
        {
          id: 2,
          value: "60°",
          location: {
            top: "0",
            left: "0",
            transform: "translateY(-50%) translateX(50%)",
          },
        },
        {
          id: 3,
          value: "30°",
          location: {
            top: "-50%",
            left: "0",
            transform: "translateY(-50%) translateX(50%)",
          },
        },
      ],
      satellites: [
        {
          name: "Below Mask",
          distribution: [
            {
              id: "10",
              long: 46.397128,
              lati: 56.397128,
              color: "#409eff",
            },
            {
              id: "08",
              long: 76.397128,
              lati: 32.916527,
              color: "#409eff",
            },
          ],
        },
        {
          name: "Unhealthy",
          distribution: [
            {
              id: "25",
              long: 156.397128,
              lati: 62.916527,
              color: "#f56c6c",
            },
            {
              id: "25",
              long: 316.397128,
              lati: 12.916527,
              color: "#f56c6c",
            },
          ],
        },
        {
          name: "Missing",
          distribution: [
            {
              id: "07",
              long: 256.397128,
              lati: 22.916527,
              color: "#118452",
            },
            {
              id: "18",
              long: 56.397128,
              lati: 27.916527,
              color: "#118452",
            },
            {
              id: "12",
              long: 66.397128,
              lati: 27.916527,
              color: "#118452",
            },
            {
              id: "16",
              long: 196.397128,
              lati: 67.916527,
              color: "#118452",
            },
          ],
        },
      ],
    };
  },
  methods: {
    top(lati) {
      return ((90 - lati) / 90) * -90 - 10 + "px";
    },
    rotate(long) {
      let z = (long / 360) * 360;
      return `rotateZ(${z}deg)`;
    },
  },
  //   filters: {},
};
</script>
<style scoped lang='scss'>
$polarPiameter: 180px;
.polar-main {
  width: $polarPiameter;
  height: $polarPiameter;
  position: relative;
  p {
    margin: 0;
  }
  .polar-1 {
    width: $polarPiameter;
    height: $polarPiameter;
    border-style: solid;
    .polar-2 {
      width: $polarPiameter * 2/3;
      height: $polarPiameter * 2/3;
      border-style: dashed;
      .polar-3 {
        width: $polarPiameter/3;
        height: $polarPiameter/3;
        border-style: dashed;
        .polar-center {
          width: 1px;
          height: 1px;
          background-color: #333;
        }
      }
    }
  }
  .line {
    height: $polarPiameter;
    border-right-color: #333;
    border-right-width: 1px;
    border-right-style: solid;
    position: absolute;
    left: 50%;
    cursor: pointer;
  }
  .longitude,
  .latitude {
    height: 14px;
    line-height: 14px;
    font-size: 12px;
    color: #868585;
    position: absolute;
    cursor: pointer;
  }
}
.polar-1,
.polar-2,
.polar-3,
.polar-center {
  border-radius: 50%;
  position: absolute;
  top: 0;
  left: 0;
  right: 0;
  bottom: 0;
  margin: auto;
  border-color: #91cc75;
  border-width: 1px;
  box-sizing: border-box;
  cursor: pointer;
}
.polar-1:hover {
  border-width: 2px;
}
.polar-2:hover{
  border-width: 2px;
}
.satellite-box {
  position: absolute;
  width: 1px;
  height: 1px;
  border-radius: 50%;
  background-color: transparent;
  .satellite {
    position: absolute;
    left: -10px;
    width: 20px;
    height: 20px;
    line-height: 20px;
    text-align: center;
    border-radius: 50%;
    font-size: 14px;
    color: #fff;
    cursor: pointer;
    z-index: 999;
    opacity: 0.6;
    transition: 0.6s;
  }
  .satellite:hover {
    background-color: #333 !important;
  }
}
</style>
总结
示例图:

到此这篇关于CSS极坐标的实例代码的文章就介绍到这了,更多相关CSS极坐标内容请搜索脚本之家以前的文章或继续浏览下面的相关文章,希望大家以后多多支持脚本之家!
相关文章
 文章介绍了HTML中img标签的使用,包括src属性(指定图片路径)、相对/绝对路径区别、alt替代文本、title提示、宽高控制及边框设置等,本文主要给大家介绍HTML img标签和超链2025-06-20
- HTML meta标签用于提供文档元数据,涵盖字符编码、SEO优化、社交媒体集成、移动设备适配、浏览器控制及安全隐私设置,优化页面显示与搜索引擎索引,本文给大家介绍HTML中meta2025-06-20
 input 标签主要用于接收用户的输入,随 type 属性值的不同,变换其具体功能,本文通过实例图文并茂的形式给大家介绍HTML input 标签,感兴趣的朋友一起看看吧2025-06-20
 这篇文章主要介绍了html 滚动条滚动过快会留下边框线的解决方案,解决方法很简单,可以将 dialog 单独拿出来别放在 transform 的子元素里,需要的朋友可以参考下2025-06-09
- 本文将介绍如何使用<img>标签在 HTML 中添加图片,并展示一些常见的用法和技巧,通过本文的介绍,应该掌握了在 HTML 中添加和调整图片的基础知识,感兴趣的朋友一起看2025-05-16
- HTML表格用于在网页上展示数据,通过标签及其相关标签来创建,表格由行和列组成,每一行包含一个或多个单元格,单元格可以包含文本、图像、链接等元素,本文将详细介绍HTML表格2025-03-12
- 本文介绍了三种禁止HTML页面滚动的方法:通过CSS的overflow属性、使用JavaScript的滚动事件监听器以及使用CSS的position:fixed属性,每种方法都有其适用场景和优缺点,感兴2025-02-24
 在 Web 开发中,文本的视觉效果是提升用户体验的重要因素之一,通过 CSS 技巧,我们可以创造出许多独特的效果,例如文字镂空效果,本文将带你一步一步实现一个简单的文字镂空2024-11-17
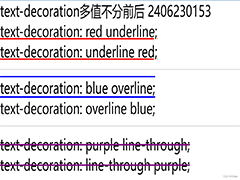 在Html中,a标签默认的超链接样式是蓝色字体配下划线,这可能不满足所有设计需求,如需去除这些默认样式,可以通过CSS来实现,本文给大家介绍Html去除a标签的默认样式的操作代码2024-09-25
- 在HTML中,可以通过设置CSS的resize属性为none,来禁止用户手动拖动文本域(textarea)的大小,这种方法简单有效,适用于大多数现代浏览器,但需要在老旧浏览器中进行测试以确保2024-09-25


最新评论