
Python利用matplotlib实现动态可视化详解
Python中的数据可视化是指原始数据的图形表示,以更好地可视化、理解和推理。Python提供了各种库,包含用于可视化数据的不同特性,并且可以支持不同类型的图形,即Matplotlib、Seaborn、Bokeh、Plotly等。
Python中的动态可视化
任何系统的动态可视化都意味着在演示过程中以图形方式表示当前系统的状态变化。在Python中的数据可视化方面,动态可视化是一个动态图形,它要么随着时间的推移而变化,就像在视频中一样,要么随着用户改变输入而变化,但在当前演示中,它就像是活的一样。
在Python中创建动态图的步骤
步骤1. 创建固定长度的队列
队列是一种线性数据结构,以先进先出(FIFO)原则存储项目。它可以在Python中以各种方式实现。在Python中创建一个固定长度的队列用于动态绘图是指创建一个数据结构,该结构可以存储固定数量的元素,并在容器满时丢弃最旧的元素。当我们要绘制不断更新的数据点时,它非常有用。通过限制容器的大小,可以提高绘制的性能和清晰度。
from collections import deque
# Create a deque with a maximum length of 3
data_points = deque(maxlen=3)
# Add new data points to the deque
data_points.append(40)
data_points.append(60)
data_points.append(30)
# display the data points in the deque
print(data_points)  # deque([40, 60, 30], maxlen=3)
# Add more data points to the deque
data_points.append(13)
data_points.append(99)
# The oldest data point is/are automatically
# removed from front of queue.
# deque([30, 13, 99], maxlen=3)
print(data_points)
输出
deque([40, 60, 30], maxlen=3)
deque([30, 13, 99], maxlen=3)
步骤2. 生成点并将其保存到队列
在这里,我们动态地生成数据点,并将它们附加到队列数据结构中,而不是像上面的示例中所示的那样执行手动操作。这里我们将使用Python的random模块中可用的函数来生成数据点。
from collections import deque
import random
# Create a deque with fixed length 5
data_points = deque(maxlen=5)
# Generate and append data points to the deque
# we iterate 2 extra times to demonstrate how
# queue removes values from front
for i in range(7):
     # generate random numbers between 0
    # to 100 (both inclusive)
    new_data_point = random.randint(0, 100)
    data_points.append(new_data_point)
    print(data_points)
输出
deque([64], maxlen=5)
deque([64, 57], maxlen=5)
deque([64, 57, 15], maxlen=5)
deque([64, 57, 15, 31], maxlen=5)
deque([64, 57, 15, 31, 35], maxlen=5)
deque([57, 15, 31, 35, 25], maxlen=5)
deque([15, 31, 35, 25, 12], maxlen=5)
步骤3. 删除第一个点
在Python中的动态绘图中,当我们生成一个新的数据点并将其添加到固定长度的队列中时,我们需要从队列中移除最旧的点以保持队列的固定长度。在这里,我们按照FIFO原则从左侧移除元素。
from collections import deque
import random
# Create a deque with fixed length
data_points = deque(maxlen=5)
# Append 5 data points to the deque at once using extend method.
data_points.extend([1, 2, 3, 4, 5])
# Print the deque before removing the first element
print("Deque before removing the first element:", data_points)
# Remove the first element from the deque
data_points.popleft()
# Print the deque after removing the first element
print("Deque after removing the first element:", data_points)
输出
Deque before removing the first element: deque([1, 2, 3, 4, 5], maxlen=5)
Deque after removing the first element: deque([2, 3, 4, 5], maxlen=5)
步骤4. 绘制队列,暂停绘图以进行可视化
我们首先使用Matplotlib绘制存储在队列中的数据点,然后暂停绘制一定的时间,以便在使用下一组数据点更新之前可以可视化该图。这可以使用Matplotlib中的plt.pause()函数来完成。在这里,在我们的示例代码块中,我们将生成一组y值,x轴值从0恒定增加,然后观察图,然后暂停它。
import matplotlib.pyplot as plt
from collections import deque
import random
# Create a fixed-length deque of size 50 to store the data points
data_points = deque(maxlen=50)
# Create an empty plot
fig, ax = plt.subplots()
line = ax.plot([])
# Set the x-axis and y-axis limits to 100
ax.set_xlim(0, 100)
ax.set_ylim(0, 100)
# Iterate through 50 data points and update the plot
for i in range(50):
    # Generate and add data points to the deque
    new_x = i
    # generate a random number between 0 to 100 for y axis
    new_y = random.randint(0, 100)
    data_points.append((new_x, new_y))
    # Update the plot with the new data points
    x_values = [x for x, y in data_points]
    y_values = [y for x, y in data_points]
    line.set_data(x_values, y_values)
    # pause the plot for 0.01s before next point is shown
    plt.pause(0.01)
# Show the plot
plt.show()
步骤5. 清除绘图
实时更新数据点时,我们将在绘制下一组值之前清除该图。这可以使用Matplotlib中的line.set_data([],[])函数来完成,这样我们就可以实时显示队列数据结构的固定大小。
import matplotlib.pyplot as plt
from collections import deque
import random
# Create a fixed-length deque to store the data points
data_points = deque(maxlen=50)
# Create an empty plot
fig, ax = plt.subplots()
line, = ax.plot([])
# Set the x-axis and y-axis limits
ax.set_xlim(0, 100)
ax.set_ylim(0, 100)
# Iterate through the data points and update the plot
for i in range(100):
	# Generate and add data points to the deque
	new_x = i
	new_y = random.randint(0, 100)
	data_points.append((new_x, new_y))
	# Update the plot with the new data points
	x_values = [x for x, y in data_points]
	y_values = [y for x, y in data_points]
	line.set_data(x_values, y_values)
	plt.pause(0.01)
	# Clear the plot for the next set of values
	line.set_data([], [])
# Show the plot
plt.show()

动态散点图
import matplotlib.pyplot as plt
from collections import deque
import random
# Create a fixed-length deque of length 50 to store the data points
data_points = deque(maxlen=50)
# Create an empty plot
fig, ax = plt.subplots()
# Set the x-axis and y-axis limits to 100
ax.set_xlim(0, 100)
ax.set_ylim(0, 100)
# Create a scatter plot to visualize the data points
scatter = ax.scatter([], [])
# Iterate through the data points and update the scatter plot
for i in range(100):
    # Generate and add data points to the deque
    new_x = i
    new_y = random.randint(0, 100)
    data_points.append((new_x, new_y))
    # Update the scatter plot with the new data points
    x_values = [x for x, y in data_points]
    y_values = [y for x, y in data_points]
    scatter.set_offsets(list(zip(x_values, y_values)))
    plt.pause(0.01)
# Show the plot
plt.show()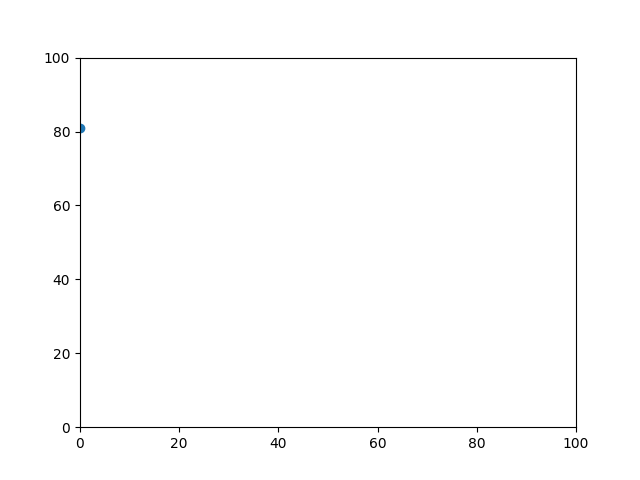
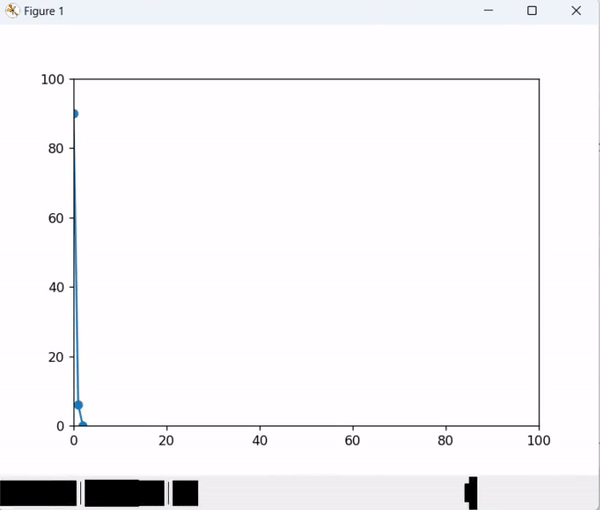
动态散点图和折线图
import matplotlib.pyplot as plt
from collections import deque
import random
from matplotlib.animation import FuncAnimation
# Create a fixed-length deque of length 50 to store the data points
data_points = deque(maxlen=50)
# Create an empty plot
fig, ax = plt.subplots()
line, = ax.plot([])
# Set the x-axis and y-axis limits to 100
ax.set_xlim(0, 100)
ax.set_ylim(0, 100)
# Create a scatter plot to visualize the data points
scatter = ax.scatter([], [])
# Iterate through the data points and update the scatter plot
for i in range(100):
	# Generate and add data points to the deque
	new_x = i
	new_y = random.randint(0, 100)
	data_points.append((new_x, new_y))
	# Update the scatter plot with the new data points
	x_values = [x for x, y in data_points]
	y_values = [y for x, y in data_points]
	scatter.set_offsets(list(zip(x_values, y_values)))
	line.set_data(x_values, y_values)
	plt.pause(0.01)
# Save the animation as an animated GIF
plt.show()
以上就是Python利用matplotlib实现动态可视化详解的详细内容,更多关于matplotlib动态可视化的资料请关注脚本之家其它相关文章!
相关文章
 protobuf是一种二进制的序列化格式,相对于json来说体积更小,传输更快,本文主要介绍了Python使用protobuf序列化和反序列化的实现,感兴趣的可以了解一下2021-05-05
 今天小编就为大家分享一篇使用tensorflow实现矩阵分解方式,具有很好的参考价值,希望对大家有所帮助。一起跟随小编过来看看吧2020-02-02
 这篇文章主要介绍了python按照list中字典的某key去重的示例代码,文中通过示例代码介绍的非常详细,对大家的学习或者工作具有一定的参考学习价值,需要的朋友们下面随着小编来一起学习学习吧2020-10-10
python PyQt5中单行文本输入控件QLineEdit用法详解
在PyQt5的GUI编程中,QLineEdit控件是一个用于输入和编辑单行文本的部件,它提供了丰富的功能和灵活性,可以轻松地实现用户输入的捕获、验证和格式化等功能,本文将通过实际案例详细介绍QLineEdit控件的常用方法,需要的朋友可以参考下2024-08-08 在本篇文章里小编个大家整理的是一篇关于python列表的特点分析内容总结,有需要的朋友们可以学习下。2021-08-08
pycharm出现No pyvenv.cfg file错误的问题解决
本文主要介绍了pycharm出现No pyvenv.cfg file错误的问题解决,主要是通过恢复历史记录中的未删除状态来解决,下面就来详细的介绍一下,感兴趣的可以了解一下2025-05-05 在Python文件操作中,路径处理是高频需求,本文通过实际案例对比,揭示pathlib如何成为现代Python开发者的首选工具,文中的示例代码讲解详细,感兴趣的小伙伴可以了解下2026-01-01
 在Python编程的浩瀚宇宙中,数字类型是最基础却最强大的基石之一,整数(int)和浮点数(float)作为日常开发中不可或缺的两种数据类型,它们之间的相互转换看似简单,却暗藏玄机,本文将带你深入探索Python中整数与浮点数相互转换的完整知识体系,需要的朋友可以参考下2026-04-04
Python安装、卸载及环境配置全指南(解决常见问题与报错)
Python作为当今最流行的编程语言之一,广泛应用于数据分析、人工智能、Web开发等领域,然而,许多用户在安装、卸载Python或配置环境时,经常会遇到各种问题,本文将从 Python安装、环境变量配置、卸载修复、虚拟环境管理 等方面,提供完整的解决方案,需要的朋友可以参考下2025-05-05 这篇文章主要介绍了Python对Tornado请求与响应的数据处理,需要的朋友可以参考下2020-02-02


最新评论